Artists in Residence Blog Posts 2024
Charlotte Dunn
Blog post 2 -November 15th 2024
Since my last blog post I have continued to develop my seizure forecast weather reports, expanding upon the scripts, as well as the animations, that will be used and looked into what presenters I wanted to deliver the reports.
I initially wanted to create some trial weather reports to get some experience with editing video using a green screen, as this is something I haven’t done before in my practice. I hired a green screen studio at Birmingham City University and began to trial some scripts I had created to create some trial reports with me as the presenter. I then went on further to edit the reports with the variety of animations I had already created behind me. I found I needed to work on how the animations would match the script as I spoke, as well as the actions of the presenter. I therefore further worked on lengthening the animations, as well as making the scripts light-hearted. This has allowed me to finalise that there will be 8 different forecasts all showing a variety of triggers as well as a variety of different symptoms.
https://youtu.be/Yowyc0qvmtc?si=FIWPNaMlCSOMXQb6
https://youtu.be/2iSwNMgV6DQ?si=OclDC5KTaXXviHtd
https://youtu.be/u3dHB-gxFtw?si=i5NvxsNx8bYlLFsb
At the end of October, I invited several people who have epilepsy to join me in a focus group to discuss my work, as well as give their opinions as people with lived experience. We discussed the animations and the option of whether some depiction of a brain needs to be included or not. All of the group felt it did need to be included to give more of a relation to map of the weather, as well as show the link to epilepsy. Within the group individuals also thought the bright pinks in the animations and the deep reds were quite alarming and anxiety inducing when showing the probability of a seizure, so this is something I have adjusted within the animations, I have also added a brain to the animations from their feedback.
Within the group we also discussed the language of the scripts. All thought that the forecast should be referred to as the ‘Seizure Forecast’, and that the words used should be light-hearted as well as not giving definite predictions of a seizure happening, but more around the likelihood or a percentage chance. I have taken on this feedback and now written the final scripts that will be used in the final 8 forecasts.
For the final forecasts I have been working on looking for suitable presenters including approaching the BBC as well as ITV. I put out an advert to all Birmingham City University Media students who then applied by sending in showreels to me to appear in the forecasts. I have now chosen 2 people who will star in the forecasts with the final filming next month. I then hope to edit these forecasts with the new animations featuring the brains.
In terms of presenting the forecasts I would like them to be played on a standard TV in a living room type setting, giving the illusion of a real weather report, highlighting that these forecasts are part of someone with epilepsy every day life, just as watching the weather is for anyone else.
Christie Swallow
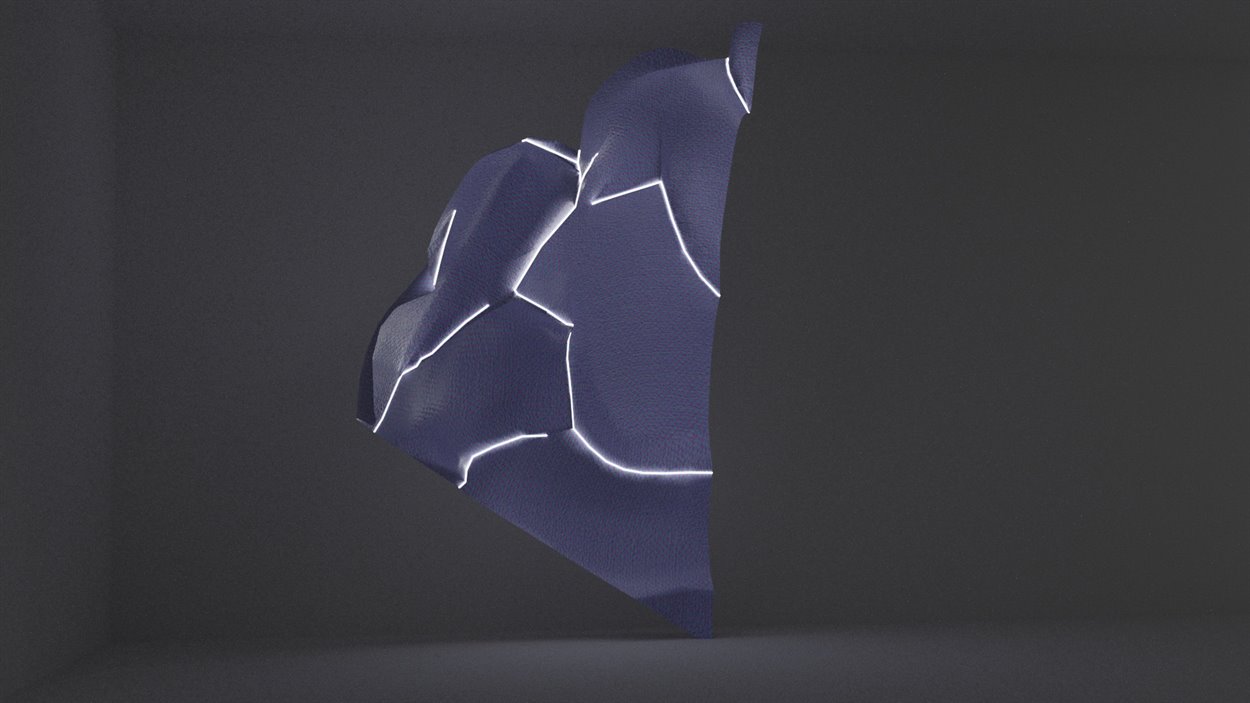
I have continued to explore the medium of textile’s capacity to articulate neurology in novel ways. I have been particularly interested in creating “topographies” derived from fMRI data - landscapes of the brain. I have explored this idea through the datasets made available on Neurosynth.org, which correlate monitored neurological activity associated with different conditions across published papers. The result is a sort of “heat map” of correlation between these studies. Working with 3d visualisation software, I am able to convert these datasets into 3d data, which I have then fabricated in textile form. The result is a series of landscapes that do not exist within any one brain, but traverse the neurological activity of myriad patients.
In my practice, I always aim to work with materials that have poetic, or symbolic, association with the project’s subject matter. During my research I came across a promising study on the possibility of using silk fibres for repairing nervous systems. I work widely with silks and silk-weaving processes, in particular with organza, which results in a lot of textile waste. I have been exploring methods of re-using this waste material through the cross stitching scraps into a composite material, creating a kaleidoscopic sedimentation of scrap organza. This restorative process of creating new connections between the organza scraps has sympathy with the reconstructive abilities of silk within a clinical setting.
As we reach the end of this residency, I am focusing on completing a series of neurological topographies, alongside a smaller series of textile embroidery works. Going forward, I am interested in the different opportunities that my novel translation of MRI data into 3D data might pose, namely the possibility of working with animation and moving image.
Alexandra Davenport
Project Introduction
I’m working with a team of researchers on the project “Directed forgetting in human brains and artificial neural networks.” In this project, the team are training an Artificial Intelligence (AI) neural network to perform a working memory task, which will allow them to study active forgetting in human brains. Traditional forms of brain imaging, such as fMRI are limited as we cannot trace individual neuronal activity – and so this is where AI can assist.
Flat lay of the artist book 'What Happens in that Moment?' (work-in progress), 2024.
Since my last blog post, I’ve been continuing work on my artist book ‘What Happens in that Moment’, which aims to reflect the process-based nature of the project, but also the process involved in training the model – in particular the relationship between human and machine learning. The book is split into “chapters” to reflect the different phases of the project and I’m currently in conversation with a publisher to develop my book dummy into a finished artefact next year. I’ve also continued meeting with the team either every week or two, and we’ve welcomed a new team member Han Hu who is assisting with the AI architectures.
Artist post-it notes from team project meetings.
Project Update
The team began by training a Recurrent Neural Network (RNN), which is well-suited for this research due to its ability to recognise patterns, but also maintain a memory of previous inputs – mimicking the neural mechanisms of the human brain. I refer to this in my book as ‘The Forgetting Model’. In this chapter, I’ve responded by recreating the visual from the paper our model is based on, as well as including transcripts from conversations with the team, found imagery and a ‘comments’ interpretation of the training inspired by comments found in the code of the model.
Flat lay of the artist book 'What Happens in that Moment?' (work-in-progress), 2024.
The basic premise is to give the RNN 2 colours to remember, and then after a short pause we signal that one of the colours is “the one that matters”. After another short pause, we then ask it to correctly identify the correct colour that matters. We are trying to train the model to learn that something is irrelevant, however in the longer term, the interest is less about how consistently the model gets the item correct – but rather, what is the activity when the model knows it no longer needs the other information?
There was always a plan with this model to introduce capacity constraints (or “noise”) to the training. This is because the capacity of human working memory (the number of items we can keep in mind at one time) is quite low – somewhere between 3-6 items. However, the RNN we are training has a potentially infinite working memory capacity and so the behaviour wouldn’t simulate that of human brains. It quickly became apparent that capacity was not the only issue. In addition, the model also has no reason, or “incentive” to forget the information we’re requesting it to. This notion is fascinating to me and inspired further thinking around AI and human learning in my research.
An additional research paper was introduced at one of our meetings, which is focused on working memory capacity constraints. I refer to this in my project as ‘The Working Memory Model’. This paper proposes a new model of working memory that captures its flexibility and capacity limits using simple, biologically inspired mechanisms. This is exactly the type of mechanism we were looking to introduce to ‘The Forgetting Model’.However this model is built using a combination of a sensory and random networks, which are not “trainable” in the sense that the RNN is. And so, the team currently has 2 separate pieces of code for each task but are working to combine these to develop a hybrid model. In my book, I’m referring to this as ‘Working to Forget’ and will continue to document the progress as it develops.
Earlier in the project, my plan was to develop a performance based on the comments in ‘The Forgetting Model’ code. However, I’ve instead used these comments as prompts for visual pairings to reflect the gestural nature of the comments e.g. ‘#Forward Pass’.
The images are taken from sports training manuals, and my intention is to mirror the repetition required for training the model with the training required to commit a movement to muscle memory.
Flat lay of the artist book 'What Happens in that Moment?' (work-in-progress), 2024.
I am still hoping to develop a performance, but this will instead focus on the ‘Working to Forget’ hybrid model through a choreographic approach. The inspiration for this has been the different structures and representations of time in the two models, as well as the suggestion that there might be some kind of binding mechanism that makes “some memories sticker than they should be.”
Dan Auluk
www.danauluk.com
Final Blog
During this residency I decided early on to look back into my traumatic past of processing grief and accepting my sexuality and reconciling my religion, culture and faith. This research reactivated memories of the past which were difficult to process but healthy and healing for me to do so. I made sure I protected myself by journalling through creative writing, spoken word, looking back at family photographs, making art, talking to my mother and my partner and friends, all of which certainly helped my self-care. Re-reading the book On Grief and Grieving: Finding the Meaning of Grief Through the Five Stages of Loss (2005) by Elisabeth Kubler-Ross David Kessler; is also helping as well as understanding self-compassion better; the self-kindness, common humanity and mindfulness. I started off this project from a personal lived experience in my teens of not accessing any medical intervention to help with my situational depression and to utilize creativity as self-care and to see how this may help, in reference to well-being and neuroplasticity. This is ongoing personal research that I am still discovering.
The scientific research team are developing mathematical data analysis from comparing sets of data for people living with depression on standard depression medication versus psilocybin (one of the key ingredients in magic mushrooms). The team are looking at a potential future where patients have better choice, perhaps, or at least having a better conversation with their GP; in choosing what medication may work for various forms of depression. I feel choice is the key word here; developed through awareness and knowledge building within marginalised communities and for people living with depression that affects their daily live, and to reduce stigma and any barriers that exist around mental health. It’s also interesting the words used in the scientific research such as:
‘Non-normality’, ‘functional and effective connectivity’, ‘transform matrix’ – all these in some way describe or inform my trauma in my teens and twenties and the art I am making.
A digital booklet
Over the last three months I produced a digital video booklet seeking feedback from the participants who took part in the public engagement workshops in August 2024.
https://vimeo.com/1036791177 (digital booklet with artwork from the participants from the public engagement workshops)
I have also been responding to the creative outputs from three fellow creatives from the field of visual arts and horticulture, who I offered mini commissions to develop a response to my research. The feedback from everyone involved is that creativity can offer space, and the making process can offer valuable safe space where intrusive thoughts are reduced. There is something in the actual making, reflection and approach of making which can sometimes trigger difficult and complex emotions from which healing can begin to emerge. Treating creativity as a daily self-care routine may hold some temporary benefits.
Mini art commissions
Mini commission 1 - Dr Sally Bailey - Sally Bailey is an artist, writer and researcher living in the West Midlands. She successfully completed her practice-led PhD at the Birmingham School of Art, BCU, in November 2021. Her thesis - Locating a Space of Exchange: re-imagining the liminal in contemporary painting practice - reframes the liminal as a conceptual space between painter and painting, process and outcome; examining how the painter can exploit the potentiality of this transformative space to develop experimental practice and push forward current thinking.
https://www.sallybailey.co.uk
after / before
mal / functioning
dis / connections
sub / conscious
and what is
imagined / memory?
pushed down / brought forward?
even real?
Sally created text and a mixed media painting to which I converted through video editing to explore movement and distortion. Sally talked to me about how uncovering journals and writing from the past can take us to a place where a response to trauma lived the recycling of these writings allows for new beginnings that otherwise would not exist.
https://vimeo.com/1036798500 (A video response to a photo of a mixed media painting by Dr Sally Bailey: title: Painting Trip (2024))
Mini-commission 2- Jamie Cox – horticultural and photography, based in Birmingham, UK.
“I decided to look at root structure and how they visually relate to the brain and networks. I mostly used my allotment space for the photographs and resampled them using an AI program. I’ve never been commissioned for an art residency before, but it was helpful in terms of making time to think through my own self-care, mental health and wellbeing.”
Jamie produced a series of photographs to which I also converted through video editing to explore movement and distortion. I am also working with further photographs from Jamie Cox to develop a deeper look into root structures and visiting him on his allotment, a place where he feels happiest. He tells me how being outdoors on his allotment has helped his mental health and wellbeing; and how fascinated he is about how things grow, taking him back to his childhood days of exploring nature. Jamie is also curious about the wildlife and the beautiful fox that came close to him and looked up at him which made his year.
https://vimeo.com/1036797097 (A video response to a photograph from Jamie Cox: Title: Root Trip (2024))
Dr Kuljit Bhogal – an inter-disciplinary artist based in Southampton. He is also an experienced teacher, group facilitator, and coach and works in the LGBTQIA+ charity sector.
"This piece was produced in response to my thoughts about using psychoactive mushrooms as a way to find relief from sad or troubling emotions. This idea that the mushrooms can offer a form of release from suffering by opening up the possibilities for how the world can be experienced." – Kuljit
Kuljit and I have been exploring a call and response art practice through the post recently and we are exploring potential digital ways of doing this too. We both feel this experimental way of collaborating allows for the unknown to be exciting and healing.
https://www.kuchbhogal.com
I responded to Kuljit’s sound by using it as a soundtrack for an experimental drawing video titled 1989 in the first 3 months. Currently, I am playing with Kuljit’s sound piece further, creating distortions that may harmonize or resonate with my wellbeing.
https://vimeo.com/1036800772 (Video titled 1989 (2024) re-edited using a sound file from the artist Kuljit Bhogal as part of the SMQB UOB residency.))
Current and future steps forward
Currently, I am working towards various video responses, and I am hoping to showcase a projected video for next year’s exhibition and a potential ad-hoc spoken word performance, which I am excited about. I am also going to continue playing around with experimental drawing approaches and develop these further.
The in-person workshops with attendees living with depression affirmed the importance of social connection through creativity and the value of this. In my current role I tend to run social support groups online, but the in-person experience was a valuable one, in terms of understanding non-verbal and verbal communication, observed actions and the social interaction and learning from one another in a safe space, co-curated with the participants.
Overall, I found the SMQB residency offered me emotional space and time to think through creativity as self-care and has developed my confidence to explore creativity approaches to self-care.
Thank you to Catherine, Sam and Maria for making me feel included and involved.
https://www.n-code.org/activity/the-n-code-research-incubator/
Tom Ellis
The project is progressing nicely. Since my first blog I’ve recorded in-depth interviews with two people living with Acute Compartment Syndrome. It was a mixture of feelings undertaking them. It was hard, humbling and inspiring to hear their journeys, right from the moment the accident happen to them, right the way through to living with ACS to the present day.
One person living America and one person in the North of England. I feel the recordings give a detailed look into the medical but also the emotional experience, I really appreciated the openness in sharing their life stories. It also puts a certain pressure on myself to create something worthy in the art I’m creating to represent their thoughts and experiences.
My animation is coming together really well, I've created 115mins and 7 scenes. I’m looking forward to sharing some edited sound clips of the interviews and visuals of the animation very soon with my research team. It’ll be useful to hear their thoughts and suggestions. Otherwise I will be pushing on with filming new scenes for the animation and hopefully finalising two more interviews.
Andee Collard
Movement as a window to infant brain development
I am an artist with an interest in using technology as a tool within my practice. The SMQB collaborative project hits on a current area of interest in using motion capture and over data techniques to make my work.
I spent two days with Andrew, Barbara, Anya and Tommy, being shown the very beginning of this project. I was struck by the team’s vast knowledge and the similarities between their scientific research and my artistic practice. We are both using captured data processed by code to make some sort of output. In some cases, the approach was eerily similar.
This project is exciting because the team are creating technology for new uses. There is very little data around Magnetoencephalography (MEG) in children due to the cumbersome equipment previously used and the required focus and exact cooperation needed by adult participants. The team’s genius plan is to implement a more portable (MEG) headset and use motion capture and machine learning techniques to process the data to separate the signal from the noise. For instance, a child might be playing and disturb the headset making the data for that segment useless. By using ML to find footage of intentional movement the team can back solve and find the relevant data. This notion of processing data to find the needle in the haystack is very inspiring.
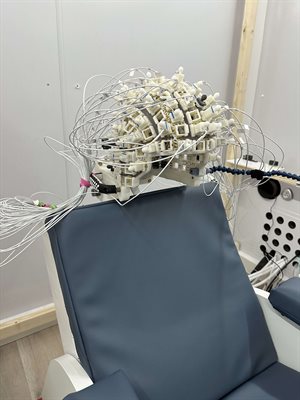
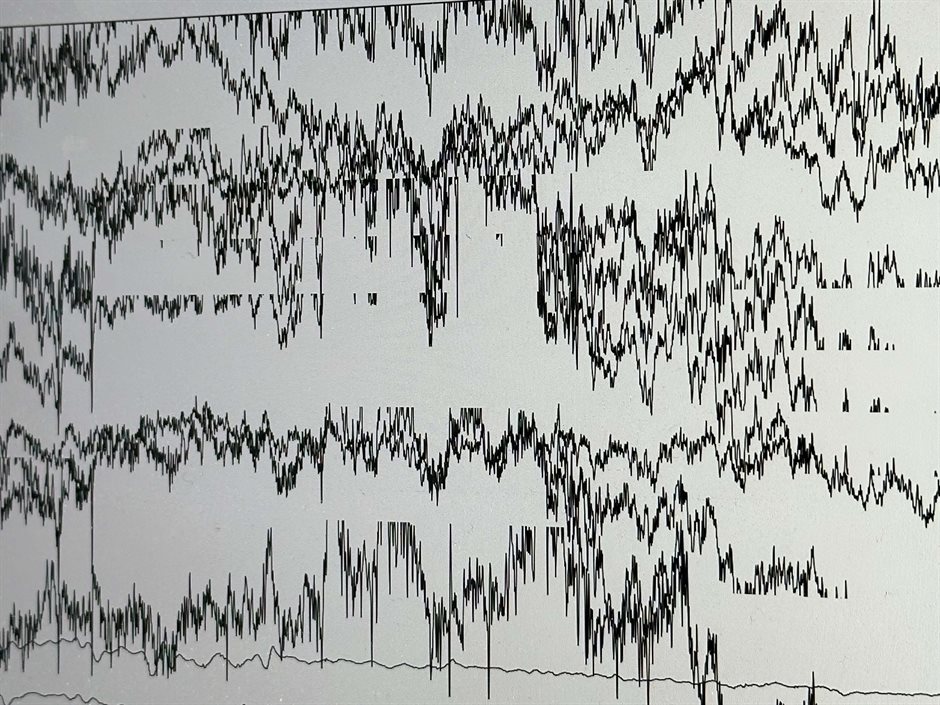
During my time with the team, I began to explore methods inspired by their approach. I started to experiment with ml5.js, a machine learning library that I can use with P5.js. ml5.js has pre-trained models to do motion capture and body segmentation. When I showed this to Andrew, Barbara and Tommy they were impressed by the real-time nature of this library.
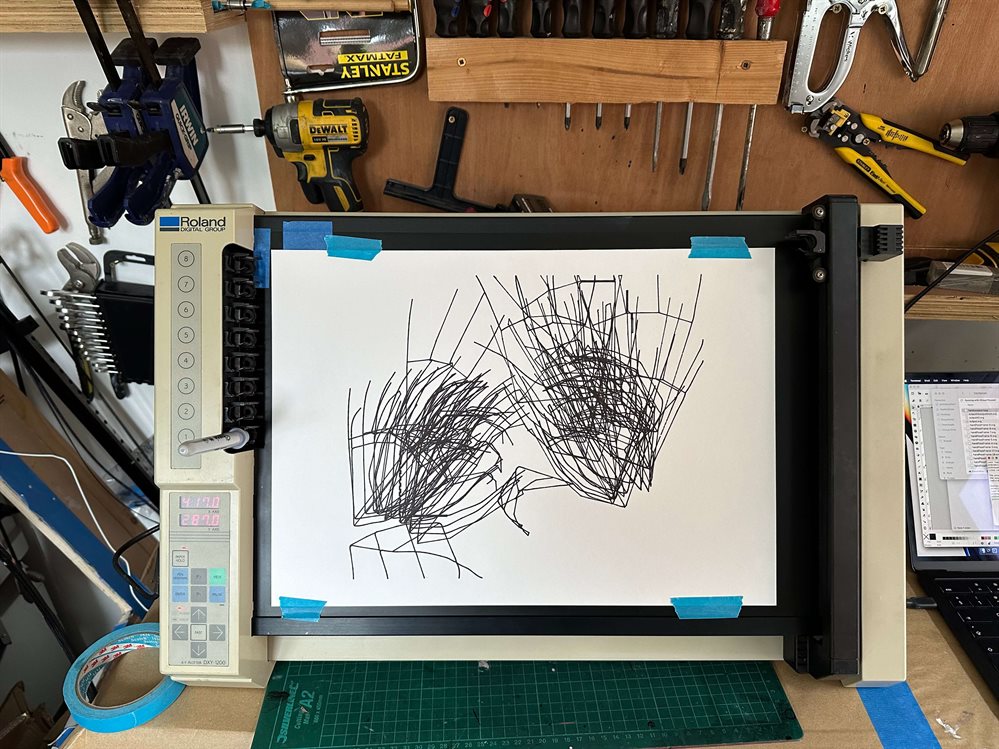
After my visit I explored methods of editing areas of interest from video using Chat-GTP. I filmed myself and was able to create I workflow to ask Chat-GTP to select sections of video where a particular action occurs and then use the timecode of this event to edit the footage using FFmpeg. I am interested in approached like this that allow me to sort the signal from the noise.
As the project continues, I want to further explore motion capture and the LLM powered video editing. Ideally, I’d like to present videos and other ways of presenting the processed data captured. There is potential to collaborate with the team on producing live pieces to engage with the public and talk metaphorically about the research.
Christie Swallow
I’m Christie, I’m an artist and designer who works with textiles, spatial design and collaborative making practices. I have a background in architecture and environmentalism, and am interested in using art to explore, interrogate and re-imagine our existing ways of seeing the world in an age of great technological change.
I'm working on a project focused on finding ways to better categorize and predict psychotic disorders in order to eventually create more personalized medical responses to different conditions.
It's fascinating to work in a truly disciplinary collaborative team. I have a background in art architecture, the broader team have backgrounds in data science, mathematical topology, machine learning and psychiatry, providing a rich variety of perspectives and attitudes to approaching the work.
It's been interesting being the member of the team who is who has much less technical knowledge of the data and technical elements, but does have an understanding of 3d modelling which has led me to explore different methods of visualising data. For instance, I’ve been experimenting with FMRI data and converting this into 3D spatial models, moving between medical software into architectural visualisation software, and ultimately into textile/pattern drafting software, exploring how I might use this pipeline to create large scale textile installations based on the topology of the brains.
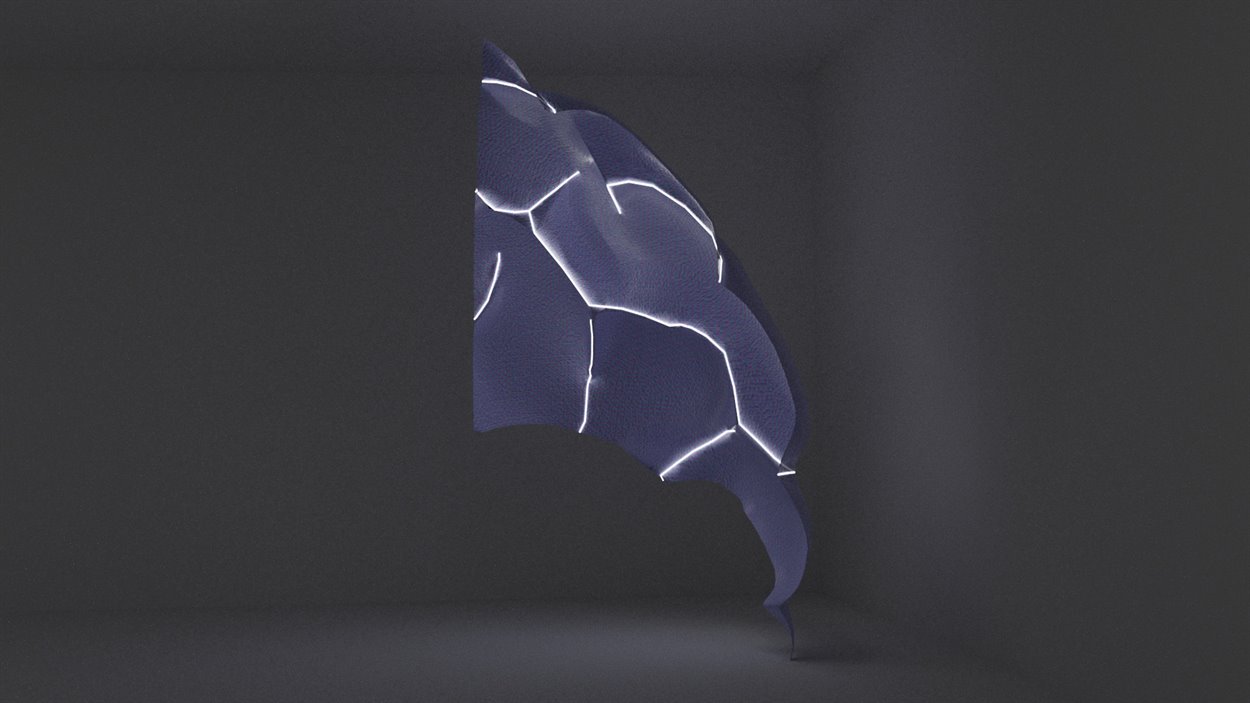
Alongside exploring the interplay of data and 3d modelling I’ve been particularly inspired by conversations we’ve been having in our team about the attitude and perspective towards psychosis. We’ve been discussing how the topic is spoken about with a lot of heaviness and austerity, in very negative tones without appreciating the incredible talent people living with these conditions also possess. I'm interested in exploring what it means to be trapped within one's own brain to be subject to hallucination and what consciousness means as a phenomena lived through this this amazing organ we call the brain.
I've been particularly inspired by Emily Dickinson’s poem The brain is wider than the sky, the first verse goes as follows;
The Brain—is wider than the Sky—
For—put them side by side—
The one the other will contain
With ease—and you—beside—
Dickinson herself is believed by historians to have suffered from psychosis. The poem's message, that our lived experiences are ultimately mediated through the brain, and therefore our brain is something which encompasses those experiences, fascinates me. This led me to imagine how I might create a brain that is wider than the sky.
Currently, I'm iterating through different designs for what this could look like. I'm hoping to eventually install these works at the at the closing exhibition of this residency. In my practice I like to be intentional with every material choice. In this project, I’m exploring using silk for the primary textile as recent publications have indicated silk fibres may assist in the restoration of nervous systems. I’m further exploring printing patterns derived from the MRI data unto these surfaces.
Dan Auluk
www.danauluk.com
My approach and 'imposter' syndrome
My approach to any artwork and research typically begins with exploratory drawing and creative writing. These initial steps allow me to refine my focus and further develop a specific visual direction.
The title of the research project is "A Mathematical Method for Connecting People Living with Depression to the Right Treatment." The researchers are comparing functional MRI data set from ‘patients’ who took standard antidepressant medication with those using psilocybin, a naturally occurring psychedelic component found in 'magic' mushrooms. The aim is to explore whether we can predict better which depression treatments might be most effective, thereby offering ‘patients’ greater choice in their treatment alongside talkative and/or art therapies.
After several weeks of grappling with imposter syndrome, and after facilitating ‘creativity as self-care' workshops, I now feel more confident that I am contributing meaningfully to the overall research.
I am grateful for the time and space I have been given to reflect on the research and develop my visual responses; and I am fortunate to work with a friendly and supportive research team. I particularly appreciate the collaborative nature of our internal blog and research channels—these have been invaluable. Thank you, Catherine, Sam, and Maria, for your support.
Starting Point - travelling back to trauma
I began this project in my usual way, engaging in informal conversations with my partner and my mother, looking at family photographs, while reflecting on both my present and my past. This led me to revisit the year 1989, a period marked by significant personal trauma—the sudden loss of a sibling and the challenges of coming to terms with my sexuality and the anxiety and depression surrounding this.
Just before this project started, I was invited by Kuljit Bhogal (Visual Artist and co-founder of The Open Minds Project (TOMP)) to co-facilitate a creative writing workshop for TOMP’s annual celebration event. Facilitating this workshop helped my confidence and formed early preparation and thoughts. For this workshop I decided to allow vulnerability as a strength and nervously performed a spoken word piece (Her Favourite) to room full of people. This was a rewarding experience. By being vulnerable this allowed others to take part and produce some powerful pieces of creative writing.
In her book, Daring Greatly, Brené Brown describes vulnerability as "uncertainty, risk, and emotional exposure." It's that unstable feeling we get when we step out of our comfort zone or do something that forces us to loosen control.
TOMP is currently transforming into becoming “The Suryan Collective” and as part of this change, they have been reflecting on how they can be more inclusive in representing, engaging, and supporting South Asian LGBTQ+ peoples and the diversities of their heritage cultures.
Shortly after this project started, I had a welcome break to work at London Pride and march with LGBT HERO, where I facilitate online social support spaces for diverse LGBTQ+ communities. Attending London Pride march for the first time was a nice and welcomed emotional release. Spending this joyous time with my partner made me realise how far I had come and left the trauma of 1989 where the future looked bleak. I wonder how we can never leave trauma completely and in what ways it can be retriggered when we least expect it, even in times of joy; but I am resilient enough to be mindful of its effects.
Title:
Do you like my pearls? (A surprise kiss!) - London Pride (June 29th, 2024)
AI
I tentatively used Chat GPT (an AI app) to see if it was able to list the types of depression. One of the depression types it offered was ‘Situational Depression’, which I connected with the most.
AI told me “Situational depression highlights the importance of resilience and coping mechanisms in mental health, and it underscores how life's challenges can significantly impact emotional well-being. Early intervention is key to preventing situational depression from worsening or leading to more serious mental health conditions.”
Some words: Creativity as self-care | Neuroplasticity | Self-soothing gestures | Roots | Networks | Memory | Mushrooms | Body scanning | Grief | Fear | Vulnerability | Anxiety | Depression | Brain scans | MRI | Wearables | Maths
Early Doodles and drawing experiments
I also started to play around with a Doodle that researchers Catherine and Sam had posted on our internal blog from the 2-day incubator event, where artists and researchers got together to get to know each other and the research. Also, great to meet the AMIGO’s who helped in terms of translating some of the language in a way that was easier to understand and offering their own lived experiences perspective of mental health and wellbeing.
https://vimeo.com/1005453862
The response above led on to further thinking now how to perhaps experiment visual about my trauma of 1989. So, I started to write various pieces of poetry as a way of carefully and mindfully unpacking thoughts around grief.
I next decided to create further short creative writing exercises into an experimental video response which I submitted to the Summer Showreel at Eastside Projects. Ethically, I am always conflicted in what I share publicly when it comes to the private but eventually, I carefully develop what I feels works.
Eastside Projects Summer Show Reel 2024.
https://vimeo.com/1007232191
Creativity as self-care
In late August I facilitated and co-facilitated another workshop; ‘Creativity as self-care through drawing approaches’ and ‘Depression and brain networks – a cognitive approach’ (delivered by researcher Dr Maria Dauverman); for gay, bi, trans, queer and questioning (GBTQQ+) men with South Asian Heritage who are living with or have lived with diagnosed depression.
The participants who attended gave some valuable feedback in terms of how their isolation was reduced and wellbeing improved through being creative during the workshop and the social connection with other South Asian GBTQQ+ men. Overall, the participants felt included and involved; and developed further insight into the research.
Maria and I thoroughly enjoyed all the activities and were pleased how the participants trusted the process and added value to the overall research. I am next developing a digital response to the art produced with and for the participants who attended, with a follow up creative check-in on Zoom. I feel it is important when we are working with groups of people, we are careful not to just parachute in and then out so quickly (this can impact mental health in a negative way) but create an open space/dialogue for participants to be involved in. Channels are open for more feedback for this valuable public engagement.
Next 3 months
Over the next 3 months I will be working on the following goals:
- To produce a short film composed of digital paintings responding to music/experimental sound and reflecting on family photographs.
- To continue to hand draw as many imaginary mushrooms as I can.
- Responding to photographs of root type structures found in our garden and allotment space.
- Continue to respond to activity for small mini-commission I have given to three creatives (Dr Sally Bailey, Jamie Cox and Kuljit Bhogal) - who through the month of September are responding to my research and practice and vice-versa.
- A creative check-in with the participants in November.
Alexandra Davenport
Artist Blog post 1
Introduction
I’m working with a team of researchers on the project “Directed forgetting in human brains and artificial neural networks.”
My interest in this project stems from my long-term fascination with the human brain, as well as how art can intersect with science. The opportunity to work directly with subject matter experts on a live research project is a very exciting next step in my practice.
My background in photography has also stirred my interest in the Artificial Intelligence (AI) aspect of the project. The inception and development of photography in the 19th century shares many similarities with the increasing development and use of AI (such as technological advancement, societal impact, ethical concerns). This is an additional thread I hope to weave into the work I make.
Project Overview
The team are training an AI neural network to perform a working memory task, which will allow them to study active forgetting in human brains.
Traditional forms of brain imaging, such as fMRI, are limited as we cannot use them to trace individual neuron activity – and so this is where AI comes in. The team are currently training a Recurrent Neural Network (RNN), which is well-suited for this research due to its ability to recognise patterns, but also maintain a memory of previous inputs – mimicking the neural mechanisms of the human brain.
Previous studies using RNN’s have focused on memory itself, whereas this project is interested in forgetting. The challenge, however, is that through training – these AI models become increasingly more competent at the task presented to them. To counter this, the team are working to introduce capacity constraints (or “noise”) into the training to mimic the complexities of working memory in humans.
Artist Work in Progress
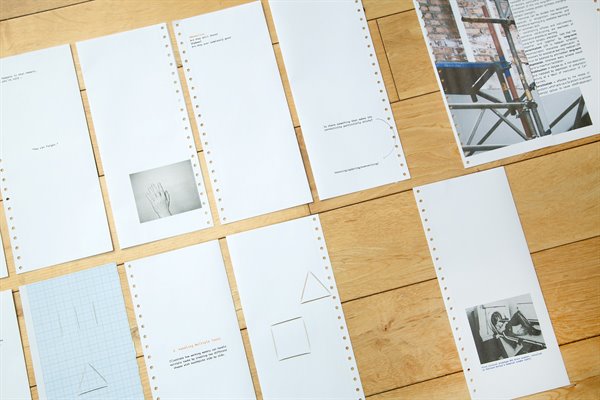
I’m currently working on a book which interweaves text, research, photography, found imagery and more. The aim is to reflect the process-based nature of the project, but also the process involved in training the model – in particular the relationship between human and machine learning. To understand this process better, I’ve shadowed the Centre Fellow (Danny) during the RNN training and have attended several progress meetings with the team.
“What happens in that moment when you’re told you can forget? “Is a quote that has stuck with me from our initial research incubator workshop. I feel like this perfectly encapsulates the project, and so I have borrowed part of this as a placeholder title for the book. There is also something fascinating to me about the prospect of training an AI model to forget, or to be less “efficient” as this seems to be in contradiction to what is often their purpose. I’m going to continue working on the book over the next few months and eventually, I hope to develop a performance piece in response to the AI model training process.
Tom Ellis
I'm really enjoying working with the SMQB team. My collaborative project focuses on 'Improving the diagnosis of acute compartment syndrome'. From the first time we met at the introductory event, the group have been really open to my ideas and the way I want my final artwork/film to organically evolve. Also how it can benefit the research and future scope for understanding the condition after the residency.
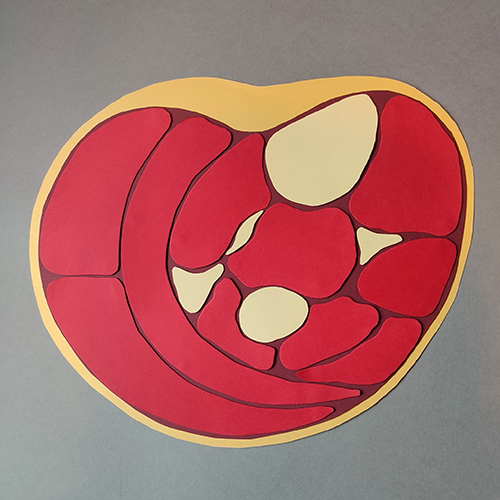
I am going to create an artwork / series of artworks to represent the condition. This will be in the form of a collaged card / layered artwork to show a cross section inside a leg when the compression of the muscles has occurred during the event of acute compartment syndrome. I have been using a projector to create sketches /designs. They have allowed me to create more accurate and vivid images that can slowly be worked up into bigger artworks.
 I'm also planning to make a more abstract film based on the reflections of patients who've experienced the syndrome and clinicians who have to treat/diagnose it. These reflections shall be sensitively recorded by myself in an event coming up in September. This is organised by the whole of our SMQB team and will feature talks and discussion. Really looking forward to this personally, as it will give me that extra inspiration for my film.
Charlotte Dunn
https://charlottedunn.co.uk
@charlartslive
Blog 1 - 3rd August 2024
Within my project I am working with a team of researchers who are looking into developing mathematical models of seizure forecasting in epilepsy. This project particularly attracted me as I was diagnosed with epilepsy myself 10 years ago and one of the main concerns that arose through my diagnosis as well as many others living with epilepsy is the unpredictable nature of seizures. Seizure propensity tends to be influenced by “triggers”, for example sleep deprivation, stress and alcohol intake intake. The team I am working with are analysing these such triggers and quantifying these using data from wearable devices. This will then look at giving a patient a seizure forecast for their day, giving them an idea of any seizures they might experience depending on the trigger factors they have been exposed too.
To start the project I began to look at the procedures the team were using to predict the seizures. They were effectively taking a collecting of factors or ‘triggers’ of data and comparing these against a persons usual activity to provide them with a forecast of their seizures. This is something that the patient would check every day and then allow them to plan their day, something we all do when looking at the weather forecast, something that was initial thought when looking at the process.
Weather forecasts are made in a similar way, by collecting data about the current state of the atmosphere and using an understanding of atmospheric processes to predict how the atmosphere will evolve, giving a future forecast. Before any forecast can be made, a meteorologist must first understand what the current weather conditions are and what is producing them, a lot like how the researchers are looking at what triggers are causing the patients seizures. This is done by examining a large quantity of observation data including surface observations, satellite imagery, radar data, radiosonde data, upper-air data, wind profilers, aircraft observations, river gauges, and simply looking outside, comparable to what my team are doing in looking at the collection of seizure triggers, such as stress hormones and sleep activity. This similarity between weather forecasting and the seizure forecasting my team are proposing, has led me to look into creating a series of weather forecasts that would speak about a persons seizure activity rather than the weather. I propose for the forecasts to be filmed as if they they were the same as any weather report we see on the television everyday, but the speaker will be speaking about seizure activity rather than the weather. Behind them as well will be a distorted image that shows in some way activity of the seizures coming and going. This nature of a seizure forecast becoming something we see and watch in our everyday lives, not only shows people that seizure activity is a part of a patients everyday life but also bringing seizure forecasts in to their everyday activity.
I have have begun creating short scripts for the weather reporter to read out, basing these on common weather reports but replacing weather factors with seizure triggers, allowing the overall forecast to become more related to the seizure forecast but still keeping the style of a weather report. For example…
“Welcome to the seizure forecast. Now, let’s see what your epilepsy is like today.
You have been very tired and sleepy so there is a chance of some small seizures, so don’t leave home without a friend! The temperature is around 36o centigrade. So ensure you take your medication. There may be a chance of a seizure in the afternoon as your temperature is a bit higher, at around 39o. Tomorrow and middle of the week your circadian is great. So no seizures for you, but it is quite busy and the temperature is just 35o. The later part of the day has the best forecast today. It’s cloudy most of the time but sunny this afternoon. The temperature is around 35o.”
“Good morning. We will now check the latest epilepsy forecast courtesy of our team in the studio. Let's start with the forecast in the morning. We will experience a fine day today. You will be generally seizure free in the morning but there may be chance of small seizure activity in the afternoon due to small changes in your circadian rythm. Luckily there will be zero chance of grand mal seizures due to your consistent temperature and small amounts of alcohol in take. A great sign for sunny things to come! Tour temperature will be 37 degrees. It is advised to take your medication. Now back to the studio."
I also have begun working on the imagery and animations that will appear behind the weather reporter, mapping over meteorology images and moving the colours over in the animations to show the change in the activities but taking away any geographical locations as these are no longer relevant. I have experimented in these with adding images of a brain, or without, and propose to run a focus group help determine what would help patients understand the idea of a forecast more.
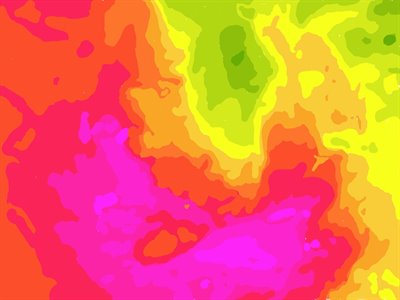
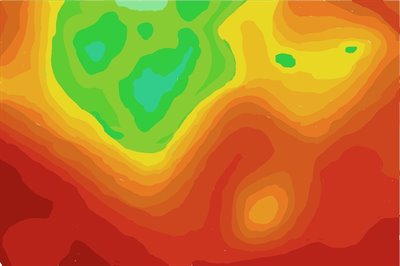
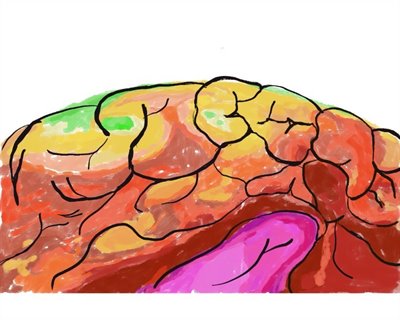
Animations with brain drawing overlay.
I am now hoping to book in a studio space to experiment with creating some actual weather reports using a presenter speaking over the images to see how these can be edited together and presented. I am also looking at involving professional weather presenters. I will also further expand upon the scripts and these will be sent to patients to see what words and terminology will be best to use for the forecasts.
Artists in Residence Blog Posts 2023-2024
Open all sections
I am an artist-writer-researcher, contributing to the project “Developing Early Diagnostic Methods for Autism using Magnetoencephalography (MEG): Combining Brain Networks and Deep Learning”.
As a neurodiverse person who also works with neurodiverse people, I was immediately interested in the possibilities that this project could create. There is an exciting potential that waiting list time for ASD could be vastly improved, opening access to supportive systems in a timelier manner, but also, I was quickly wary of the effects that a quantitative diagnosis might have upon contemporary understandings of autism. Because of this, I was keen to provide a qualitative reading of the diagnostic processes presented in this research project through my practice.
The study presents the MEG scan as a preferential form of data collection, particularly when working with children, because it is viewed as a more comfortable experience which is less confining than other sorts of scan. The data was gathered outside of the scope of this project; During the scan, children were asked to watch a screen, and press a button when they see a cartoon dog jump. While completing this activity, their neural network was documented. This led to a confirmation that a neurodivergent child’s brain had far more active connections than a typically developing child.
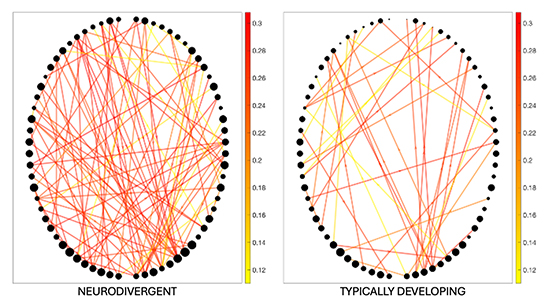
In response to this data, I thought about the many questions that I would have when presented with this task, based upon sensory, social and logistical concerns that would be present when faced with this scenario as a neurodivergent person. I mapped out some of the questions that arose from this, some of which are shown below:
The Dog:
- I like dogs, will I like this dog?
- What if there’s other animals on the screen and I can’t tell which one is the dog?
- What if the dog is scary?
- Is the dog real or animated?
- What sort of dog?
- Dogs jump differently to humans so am I looking for a dog jump or a human jump?
The Jump:
- What if the jump looks different to what I expected?
- What if the jump makes me jump?
- Will it be a jump scare?
- What if the dog never jumps?
- What if the jump is not obvious?
- How many jumps do I look out for?
The situation and mechanism:
- Will the video be too loud?
- What if I do it wrong?
- Is the room too hot or cold?
- What if the button gets stuck?
- What if I press the button at the wrong time?
- What should I say if I need help?
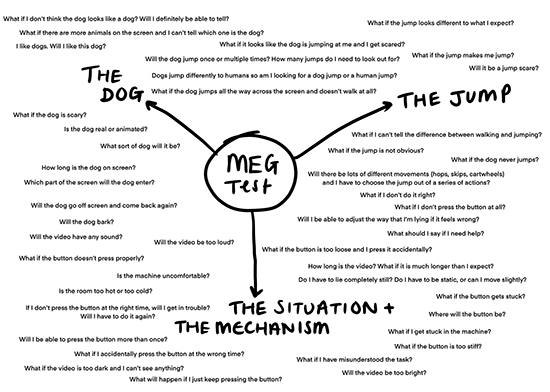
While the difference between neurodivergent and neurotypical brain network activity was visible on the scan data, the documentation of these questions provides insight into why those additional connections might be happening. This felt particularly important to me to highlight the diversity of experience which can cause such distinctive data.
From here, I began using my mind map to think about how such questions might be taking place inside the brain’s connections, and how the task might be handled differently by a neurotypical brain. I am really interested in using speculative/science fiction within my work, and so this ongoing part of my practice informed how I envisaged these questions in a scripted format, while picking out groups of activity within the scan data. Here, I imagined the connections as lines of conversation between a circle of people. This gave the possibilities of performance as a way of activating the scanned images.
The beginnings of an imagined depiction of how neurotypical brain connections might handle the MEG task
Purple line:
1) Reaction department here. I need to press a button when the dog jumps. Number 2, can you delegate?
2) Task understood. 3, can you locate the button and report back to 1? 4, can you notify the observation team?
3) Button located, see location here 1.
Pink line:
4) Number 5, we need correlating identification on a dog and a jump.
5) Dog located moving from the left of the screen. Number 6, can you alert number 1 when a jump occurs?
6) Step, step, step, step, JUMP! NOTIFY REACTION DEPARTMENT IMMEDIATELY!
The beginnings of an imagined depiction of how neurodiverse brain connections might handle the MEG task
Green line:
1) Will the dog jump at me?
2) Will the dog be scary?
3) Will the jump be a jump scare?
Light blue line:
1) Will it be okay if I change the way I'm lying?
2) If I move my fingers, will it affect the test?
3) Do I need to lie completely still?
4) How long do I have to lie here?
5) I will need to move my fingers to press the button
Dark blue line:
1) What will the button feel like?
2) Will the button be easy to press?
3) Will the button be too stiff?
4) If it is too stiff it could get stuck
5) It could be too loose
6) If it is too loose, I could press the button at the wrong time by accident.
However, my main concern with this activity was that the existence of these two, contrasting scripts is reductive, implying a binary division between the way that autistic and typically developing people will respond to this situation. Other developmental, processing and mental health conditions could all contribute similar results; For example, anxiety could prompt a similar list of questions. This helped me reach a conclusion that perhaps a tabletop roleplaying game (like Dungeons and Dragons) would be better fitting. This would allow the different contributors – working together as the brain network - to be self-directive with guidelines on their individual motives rather than delivering a script. This would allow every version of this situation to occur in a different way, and far better representing the spectrum of experience in ASD rather than expecting a template response.
At this stage, I have moved away from ideas around live performance and am working materially to thinking about how a sci-fi role playing game can be represented in a gallery format. I am interested in how visitors to the exhibition might interact with the roles and priorities of each ‘player’, prompting their own speculation on the MEG activity.
I have a multidisciplinary practice with a foundation in research. Much of my work begins in obscure legend and found objects, being particularly drawn to the stories objects have had before they meet us and the embellishments we add to both the item and the tales around it. Much of my practice looks at that which we memorialise and remember, and I seek to foster an element of joyousness in the work. I develop ideas by making, often creating a body of work as part of this process.
I was really glad to have the opportunity to work with SMQB again due to both the good memories of my part in the inaugural Seedcorn Residency Programme and because it’s a rare opportunity to be part of something that can be life changing. And on this occasion, it has given me the opportunity to be part of the development of something that is a literal science fiction holy grail.
The project is looking at computer modelling methods to speed development of extracellular vesicles (EV’s), nanoparticles that effectively transport the specific building blocks you need to heal. The key is best designing these to transport specific proteins, which is where the modelling comes in.
As a long time Sci-Fi fan it is tremendously exciting to me to be working with something on a nano scale, and something that could make these fantastic medicinal techniques a reality. The basic techniques of handling EV’s is exquisitely alien, from the fluorescent colours used to be able to see them to the use of light refraction to measure them. However, there is also something uncannily homely in their production, with many of the processes resembling food preparation.
My first experiments involved neon food dye, ferrofluid and jelly. Having been told about the movements of EV’s being similar to that of ferrofluid I wanted to see if I could create that same movement on a scale perceptible to humans.
Ferrogloop Video:
Ferrogloop video
My next experiments related to the shapes of the lipids that make up the EVs, consisting of a hydrophilic ‘head’ (which love water) and a pair of hydrophobic ‘tails’ (which avoid water). This put me in mind of rosettes, the glorious celebratory ribbons which we use to celebrate successes, birthdays and much more. I was also drawn to the notion of having the correct EV to transport the correct protein, and the centres of the rosettes seem a perfect means to represent that – and what common building block has a multitude of designs to build different things?
Lego.
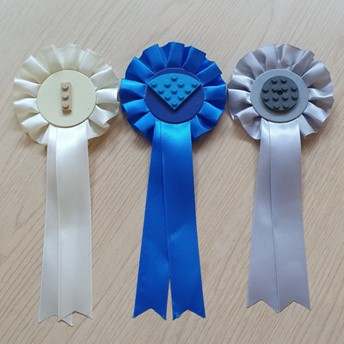
So, by filling the centre of the rosettes with Lego I had the potential to build my own model EV with Lego connectors. This then gave me the opportunity to look at other connecting materials, with rosettes using magnets, velcro and fuzzy felt to be able to ‘transport’ materials to where they needed to be.
Finally, I wanted to explore the odd homeliness of the process of making EVs, including the use of temperature changes, resting process and so on, on the final result. The process of baking shortbread uses lots of mixing, cooling, resting and so on in order to make biscuits which retain their shape while baking. So my last experiment was making a full model of an EV in iced shortbread, using a rosette shaped cutter and using neon icing to reflect the colours common in nano particle production.
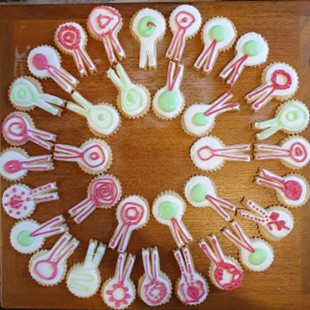
The final presentation of work is likely to be a combination of these – a display of rosettes with different fixings, each ‘carrying’ as much of the representation of the protein (ferrofluid, Lego, wool and felt) as possible, together with biscuit lipids for the audience to take away on the opening night.
When reflecting on the multifaceted aspects of my SMQB artist residency with researchers from the University of Birmingham and Imperial College, I find myself weaving together a complex network of concepts and inspirations. The team provides me with a wealth of information, and I dive into learning about stroke — as a medical condition, physiological mechanism, lived experience, an emotional path to recovery.
From dendrites and neuromuscular junctions to overexcited neurones and stroke neurogenesis, I navigate through scientific concepts and artistic inspirations. Hand exercises for stroke patients, John Bulwer's "Chirologia of the Natural Language of the Hand” and my own Tai Chi practice begin to shape my thinking about the project and its potential artistic expression.
I ponder over the nuances of muscle movements and the challenges posed by spasticity. Spasticity, as a form of stiffness, rather than rigidity, causes resistance to stretching and refuses fluid movement. As I look at my hands, I imagine interrupted circuity. I learn about associative plasticity and the rebuilding of synaptic structures. I am reminded of the Japanese art of Kintsugi, where broken pottery is repaired with gold to highlight the damage and create something new.

 A philosopher, Catherine Malabou, says that there is no bad plasticity. She talks about destructive plasticity. An explosion, which is violent and alogical, yet carries the potential for creating significantly new structures. I speak later with Jumpei and we agree that a change of language could be beneficial. Not repair, not recovery, but development. It's a subtle but powerful shift in perspective that could have a profound impact on our mindset.
I decide to apply destructive behaviours to paper and canvas, I stretch, wring and scrunch. I test larger scale, enjoying incidental monochromatic fields and layers of paint cracking into ambiguous networks.

 A visit to Neuro Rehabilitation research floor at Imperial College offers a glimpse into cutting-edge technologies and, more importantly, life-changing rehabilitation ideas.
I am here to do a mock-up test for a workshop using clay and the vibrotactile rehabilitation device. Patrick pushed hard to get the devices ready for the the first public engagement. I am struck by the juxtaposition of high-tech equipment and the messy nature of clay, and I am reminded of my initial desire that part of my artistic response should be embodied, material and tactile.
Workshop Mockup at Imperial College
We run through a series of clay exercises, tailoring them to engage specific muscle groups while wearing the device. By squeezing and releasing clay in varying intensities, we could work with spasticity and grip strength. Pinching the clay engages flexor muscles, while rolling it between both hands to create elongated coils is great for engaging both flexors and extensors. Slab-building exercise adds broader complexity. I am excited to deliver these exercises to Rosetta Life stroke ambassadors in January.
As a maker, I found it fascinating to sense how the vibration encouraged certain novel movements, creating new gestures that are aware of internal processes, potentially leading to a new way of making. Clay is a fascinating medium to think through as a juncture of techne, cheme, physio. It has an incredible malleability, akin to the human brain's neuroplasticity, that allows it to be moulded, destroyed, and rebuilt.
Clay Workshop with Rosetta Life
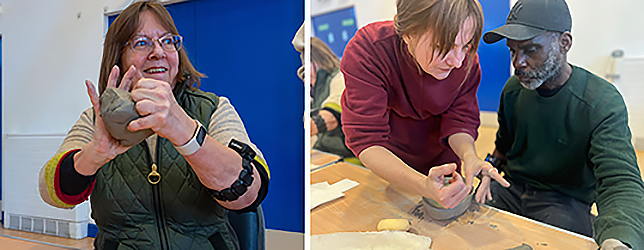
The workshop with Rosetta Life stroke ambassadors proves to be a success, with participants enjoying the artistic aspects and providing valuable feedback on the device's effectiveness. I am excited by the possibilities of combining art-making with therapeutic interventions, opening new avenues for exploration.

 Data coming back from the devices is a coded language of beautiful data. Can I use these translations? Possibly. Vibrations underpinned the project from the beginning, currently set at 80 Hz but will be reset closer to 100 Hz. The frequencies for rebuilding muscle strength lie between 2-100 Hz. Cat purring falls between 20-50 Hz anabolic range.
The radial charts make me think of webs, and incidentally, spiders tune their web frequencies to locate their prey. This will be the starting point for sonifying the output from the EMG sensors.
YouTubeEmbedAnja2
Steep learning curve and excitement of getting the initial sound output. I review the ideas with the team, and pull together their suggestions. Like adding additional notes to the trigger to produce a chord. This could make the system sound more musical, although it might also get a bit dissonant depending on the highlighted notes. Or how we could detect continuous muscle contraction e.g. could be used to increase the volume, key tones, or a number of instruments. This could be especially engaging for participants who tend to neglect their affected side.
Thinking further ahead, we could experiment with recording different gestures on one device and replaying them to another participant wearing a second device, which could lead to a "guided therapy" experience. The journey continues…
Alex Billingham (She/Her)
Working internationally across a wide range of mediums I generally pull from my lived experience of being Disabled / Trans / Neurodiverse and Queer. Seeing how my identities collide and intermingle with a variety of different subjects.
I tend to center the work around joy and fun building in space for people to feel uplifted even when dealing with quite difficult subjects. There's a lot of silliness in my style.
I’m currently exhibiting in a 6-month duo show at The New Art Gallery Walsall.
Working with SMQB has been fascinating so far. I’m attached to the team looking at how AI & humans see the world. Led by Jianbo Jiao (Computer Science), Ole Jensen (Psychology) and Cai Wingfield (Advanced Research Computing).
Seeing how my mix of Neurodiversities connects with the project from a non-academic position is fun. Making unusual connections within the work while learning a host of new skills. It’s broadened my approach to making new work.
I’m trying to turn science into art by finding ways of making it relatable and fun while trying to understand it yourself is a challenge but a fun one. I’ve been considering the idea of AI’s being fed on raw internet vs ones fed on selected images being like battery fed vs free range eggs. It’s how we raise AI's which matters.
Learning that AI's are more individual functions i.e. this is yellow etc. What we think of as AI's are actually A N N’s Artificial Neural Networks which pull together thousands of AI’s.
I’m currently building a playable 3D environment in Unreal engine 5 and making a film. Partially shot at Winterbourne Gardens.
I was delighted to be brought into the SMQB artist in residence programme, working on a project in immunotherapy for liver cancer, led by Professor Shishir Shetty. I strongly feel that art has an important role in science; to communicate the thoughts, ideas and phenomena that are tricky to communicate in words. As artist in residence, I feel an enormous responsibility to honour both the scientific endeavour of the researchers and the patient experience.
Faced with the problem of trying to understand why immunotherapy treatments sometimes don’t work on liver cancer, the researchers have been looking at cancerous and healthy liver tissue, specifically looking at what cells are interacting, when and why.
If these cells are colocalised – at the same place and time – they may be interacting. By building up a picture of all the locations of all the cells by imaging fluorescent markers attached to the cell-specific proteins, the team can work together to create a mathematical picture of which cells are interacting.
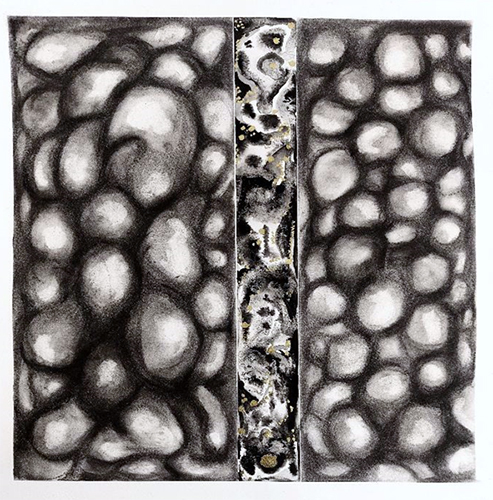
Abstract forms, looking to communicate the different regions of tissue.
Charcoal, Indian ink and gold ink on paper.
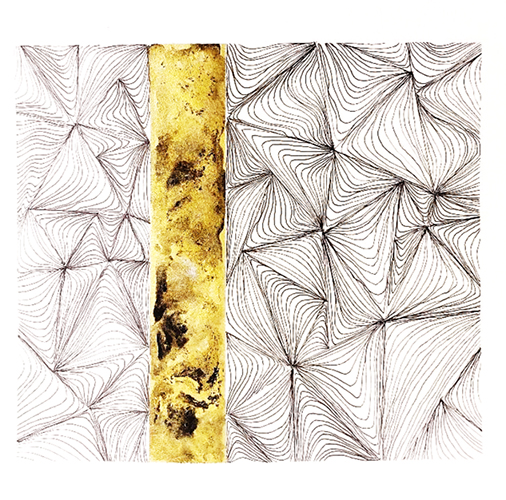 Triangulation around the peri-tumour region.Fine-line pen and water-based ink on paper.
Once I had understood this scientific question, my thoughts turned to how I would make it into art. I saw it as a giant game of Cluedo – was the immune cell inside the blood vessel with the candlestick? The colocalisation was key to the scientific hypothesis. I thought about the objects and people that an average person shares space with as they go about their day. A person might be colocalised with a box of cornflakes, a double decker bus, a squirrel in the park. Which of these colocalisations would be significant, and which would just be a coincidence? I thought about a patient undergoing treatment for liver cancer – surely they would be colocalised with doctors, medicines and hospitals. Perhaps this could be made into art.
I put this proposition to a group of liver cancer and liver disease patients, in a video call organised by the British Liver Trust. As I explained my idea, I could see that the random objects and places were not important. What was important was the people who shared their journey.
The patients went on to explain something I hadn’t considered – the complex layers of emotion that accompany a cancer diagnosis. A patient might feel sorrow and fear, but I hadn’t guessed that they might also feel guilt for putting their family through the grief of joining them on their cancer journey.
Rightly humbled, I realised that my artistic response needed to have a much more human element. If I wanted to honour the patient experience, I needed to make sure that the human connections, the people who were colocalised alongside patients, were present.
I also realised that it was a futile exercise to recreate the images captured by the scientists: the imaging data are beautiful enough on their own. In communicating the science, I instead chose to explore the scientific process: The initial clinical problem, the experiments to light up the different cells in different colours and see which ones are side by side, the mathematical methods that can be used to quantify what is seen through the microscope. I created initial works that made me think of the cancer, the peri-tumour space –a region in between the tumour and the healthy tissue, and the mathematical methods that rigorously define what it means to be colocalised.
On the human connection side, I thought of the fleeting proximity of people in different environments. If you only had a picture of two people’s hands, in a split-second interaction, would you be able to tell the significance of their relationship? Was their colocalisation indicative of an important connection, or just a coincidence?
Coincidence or human connection? Exploring the parallels between the experimental analysis – are these people significant to one another, or are they just at the same place at the same time?
Sketches in fine-line pen.
A workshop in my studio brought together the research team alongside researchers, patients and interested parties, and presented them with the question ‘what do you wish people knew about liver cancer?’. I supplied them with materials and drawing exercises to facilitate their own artistic communication. In this way, I made sure I had understood the perspectives of the patients and the researchers; to check if there was anything else I hadn’t considered.
Until this workshop, the role of stigma associated with liver cancer and liver disease was another factor I hadn’t been aware of. The associations with alcoholism, whether or not they were accurate, left patients concerned about sharing their journey with their loved ones. This was a darkness to the patient experience that was new to me. It was clear it was important to include this in my art.
At this stage, I am drawing together all these contributing factors. The cancer, the fluorescent biomarkers, the colocalisation, the human connections, the stigma, the layers of complexity, both in the multi-layered images captured by the scientists, and in the complex dynamics of human relationships experienced by the patients. I am attempting to create artworks that communicate all these different layers, of both the science and the experience. It is also important to communicate that what you see depends on the mathematical analysis you do, the way you look the data. In the same way, how you perceive the patient experience depends on how much you are willing to see, and what assumptions you let go of.
Inks and pigments in water.
To explore the human connection, and the ambiguity of colocalisation, I asked friends to send me photos of their hands beside - but not touching - the hand of someone important to them. Drawing in pen, I made the connections between these people deliberately ambiguous. To explore the fluorescence, and the pivotal role of dyes in building up the picture of the cells in and around the liver cancer, I dropped fluorescent dyes and other pigments into water, filming and photographing their dynamics. I now want to experiment with space, creating an artwork that plays on the ambiguity of colocalisation, depending on how it is viewed and interpreted.
Fluorescent inks in water. Art inspired by science.
Inks and pigments in water. Exploring the art of fluid dynamics and entropy.
Can an Epilepsy Chatbot Improve Outcomes for People with Epilepsy? An Artists Residency
I met my research group, based at the Royal Free Hospital in London, at the SMQB Incubator conference in Birmingham last year and I was immediately excited by this project. My personal history with Epilepsy is limited. Although my Dad had a brain tumour and did suffer from seizures, it was never a regular occurrence. My friend’s daughter was diagnosed with Epilepsy some time ago and I’d worked with young people with Epilepsy in a previous role. Despite all that I only knew about their epilepsy and not epilepsy in general. The conversations in our team made it immediately clear how much of a massive impact this condition has on people’s lives. My first thought was – I want to do creative workshops – with patients, family members and research staff. My team was delighted with this idea and we set dates for workshops straight away. I came away from the Incubator event with a clear remit to trial and deliver workshops and use them to create resources for the chatbot.
In October I delivered a Zoom tester workshop to my team. As one of the team members has epilepsy and another works closely with patients, participation was a very moving and humbling experience for me. We had fun, but there were some emotional moments. We knew we would have to make sure we created a safe space in the live workshops. I’d come up with activities that gave participants access to their emotions which could also provide responses that had something to offer in the way of support or teaching, to people using the chatbot. Some activities resonated better than others. I found my shortlist.
Hole in the world
Your death Leaves a hole in the world
How dare you Go – without warning without reason
When you blazed so bright
The day arrived to go to London to the Royal Free Hospital! I got really stressed out with all the travelling and my phone stopped working (updates! Grrr!) so I got lost on the way. I found the room just in time and thankfully there were biscuits and smiling faces, so it was OK. The people in my team are so lovely. Let me pause to introduce them to you:
Heather Angus-Leppan – elegant neurosurgeon, Sarah Jones – visionary and IT systems expert, Isabella Marinelli – inspirational poet-mathematician and SMQB Research Fellow, and the guys – Adam Hutchinson, Tony Wolff and Christopher Appleton, who I don’t know so well, but without whom the chatbot would not happen.
The patients, family members and friends who participated in the group all looked a bit terrified to start with, but conversation, icebreakers and biscuits sorted them out. Through the activities we had fun, got to know each other and explored some difficult feelings. The group had a lot of advice and support to offer each other and the time they spent together was really valuable. One of the things a creative activity does is to promote conversation – even to the point of just giving your hands and eyes something to do makes it easier for things to come out of your mouth. This was a benefit I’d not given enough credence to in designing the workshops. After the workshops finished, the team and I spoke about the value of delivering more live, face to face workshops. If this can go ahead, I’d definitely include more collaborative art activities to help people bond and chat together. Unfortunately this isn’t possible to do through the chatbot – but we were pleased that participants overwhelmingly wanted access to art and creative writing around the subject of epilepsy, and were open to trying activities that were internet based. We also wondered about offering digital video footage to deliver activities – a prospect that’s very exciting. Not because I like being filmed (quite the opposite, believe me!) but because, in my experience, the personal touch works better with this kind of thing.
So, what am I doing now? I’ve turned the creative products of the workshops into a format that can be delivered via the chatbot, and I’ve been busy creating my own response to everything I’ve learnt about epilepsy and what it is like to experience. Alongside the very personal responses of patients and families, I want to offer, as an artist and poet, works that are more coded that people can interpret through their own stories. To this end I’ve been writing poetry and planning a series of paintings that I hope will be thought provoking and empathic.
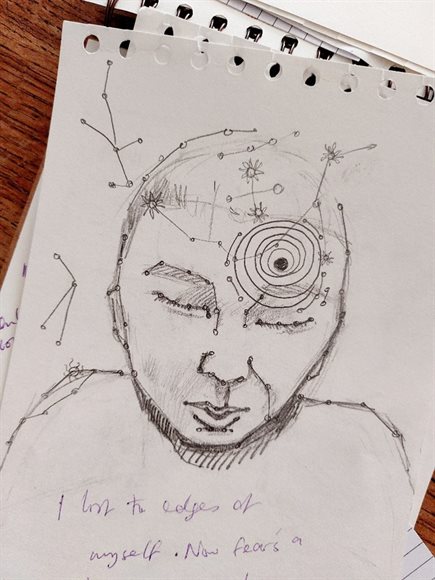
When the universe is on your side, opportunities arise that can contribute to your work. In this way, I happened to be offered the chance to have some of my writing considered for Coventry Springboard Festival. It’s a genre-bending festival which collides drama with other kinds of writing in collaboration with the company based at the Criterion Theatre in Coventry. The theme is ‘A day that changed Everything’. I immediately thought of the patients I’d met, whose diagnosis of epilepsy had been so profoundly life-changing. So, for the last few weeks I’ve been working with a group of drama-writers and actors to transform my poetry into a short drama for four voices that could be performed at the festival. I really hope this happens, but even if it doesn’t, I’m very excited about the work and you’ll definitely be able to access it in some form as part of the output of my residency.
Also fortuitously, I heard about an offer of some studio space at the Nest, home of Talking Birds Theatre Company in Coventry. So I have a week of studio time booked in which to create some paintings. I’m going for portraits – because epilepsy effects people’s self-image and identity so profoundly. They will be abstract – as I want to use them to portray different kinds of seizure – and I’m going for mixed media, so I can create a texture that represents layers of experience. I can’t wait to get painting!
I hope you’ve enjoyed this blog post and I look forwards, if possible, to meeting you at the exhibition, which will be at the Centrala gallery in Minerva Works, Digbeth, Birmingham from the 7th – 23rd June (with a party on the Friday). Please take time to enjoy the other blogs in this series. There are truly amazing artists with residencies from SMQB this year, and the research projects are absolutely fascinating.
Mapping the Mind: The rhythm of disruption.
I have been working with a research team led by Clare Anderson, involving researchers Andrew Bagshaw and Wessel Woldman, with centre fellow Sophie Mason investigating the disruption of the Circadian Rhythms and its possible relationship and impact upon the neuronal network in the brain.
My artwork response searches for equivalents between the interaction of the elements of drawing (in expanded form: incorporating moving image and three dimensions,) and this neuronal conductivity of electrical activity in the brain that develops these neuronal networks.
It involves drawing’s ability to access deeper mental processes within the brain to be used as an alternative technique to access information in addition to the EEG data.
The disruption of Circadian Rhythms, investigated by the research team as a way of predicting the development of various neurological conditions, could I felt be seen in a more positive light as artists look for ways of disrupting normal thought rhythms to access the deeper mental processes necessary for creative work.
So, although I often think my way through problems through the process of drawing, it felt appropriate that a response to the circadian cycle of night/day, sleeping/waking, dark and light should involve techniques fundamentally involved with actual light and therefore “moving image” quickly became an obvious way forward the projected or screen based. Although a group of drawings have also developed in parallel using a range of tones to reflect the use of light and dark with the light reflecting up through the white of the paper. Studies on a lightbox were also started but time proved too short for these to show significant developments, although the lightboxes played a significant role during the filming of some sequences.
As an equivalent to the EEG data from the sleep deprivation studies, I arranged artistic workshops where alternative “artistic” data could be gathered from participants who were encouraged to search out a series of gestural and rhythmical marks that felt comfortable or significant to them. Early on for speed of experimentation these workshops started using friends and the scientists involved, Cadbury college came on board as a thank you for some studio visits and ultimately sessions were arranged with participants with lived experience through the University.
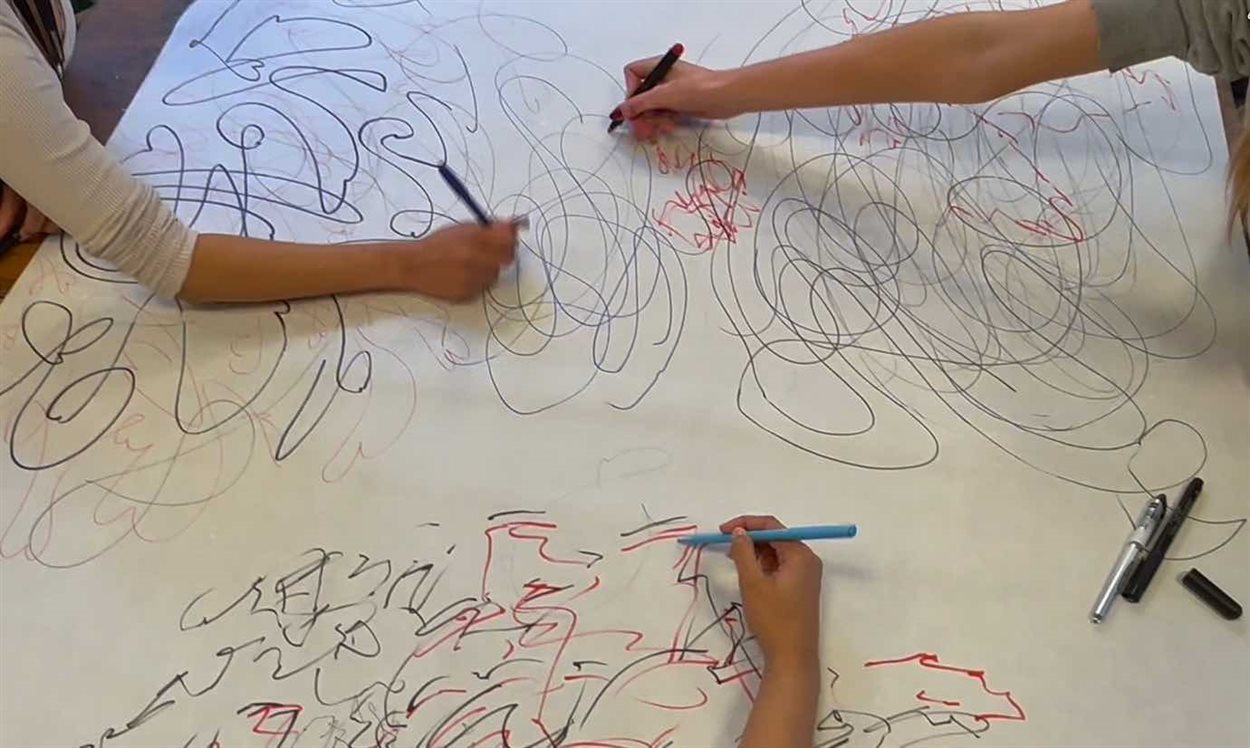
Just as EEG data is subjected to mathematical modelling through various filters and approaches attempting to analyse the data for significant rhythmical disruptions and its impact on the neuronal networks, so the artistic data was edited using various ways acting as an equivalent to the scientific analysis, producing its own data in the form of a “moving image” sequences. For example, artistic footage when overlayed was “misaligned” to reflect the “out of phase” data from the sleep study where some circadian cycles were displaced from the norm.
I was also struck by the two-dimensional and static nature of the scientific data, either printouts or information scrolling across a screen. Whereas the neuronal networks firing in the brain take place throughout the three-dimensional space of the skull and are constantly firing, admittedly at different rates, particularly at night but are never still! A constant electrical choreography is taking place in a three-dimensional space, and I felt the editing of the artistic sequence should reflect this so initial mark-making footage was further projected around three-dimensional structures and re-filmed. An energic quality was sought in the editing to reflect the constant interaction of the neurons and although this varied to reflect the changes in the circadian cycle, I felt it should be noticeably animated in nature.
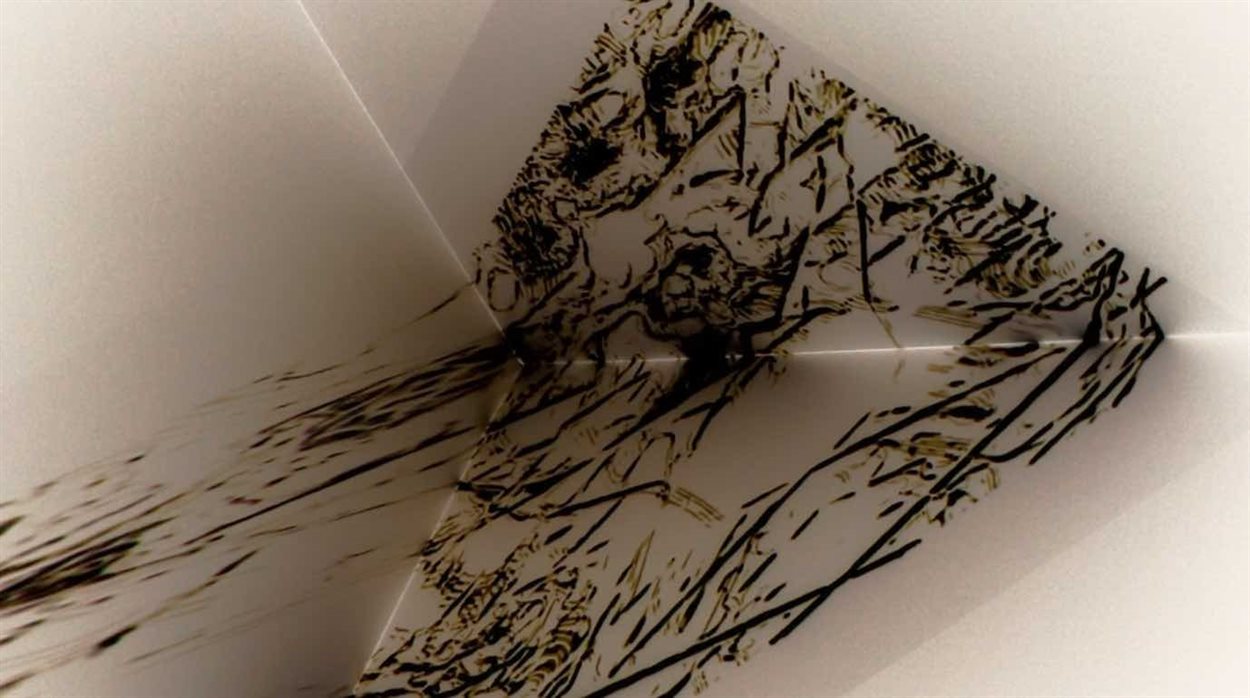
The drawings from the workshops were filmed in a variety of ways to reflect the bringing together of the different responses into a usable artistic dataset. For example, the drawn rhythms from the Cadbury College workshop were laid on a lightbox and layers were raised and lowered and moved in relation to one another to reflect the different frequencies of brainwaves that can be detected by the EEG electrodes through the skull and even from this early stage reflected the depth of activity down into the skull. As drawings were raised even the light from the lightbox was unable to stop the lower layers becoming blurred and less clear just as the electrodes in the headcap was unable to detect brain waves lower down.
No EEG
The EEG data and its artistic equivalent were then brought into a collage-like relationship and compared and contrasted. The EEG data now treated on one level as another element in the expanded drawing process and therefore could be shown vertically, inverted, or seen moving in the opposite direction but it provides a “base rhythm” against which the artistic participants mark-making is contrasted.
Projection on again negative
The same process described above was followed in the production of actual drawings in pencil, pen and ink and graphite developing in parallel with moving image pieces. With some drawings taken into three dimensions via a structure based on graphs analysed by the research team and another drawing piece developed in three sections referencing the three brainwaves detectable by the electrodes, the delta, theta, and alpha frequencies, incorporating research into the origins of the word frequency in the Latin “frequential” meaning assembling in great numbers, a crowding, a multitude, or throng.
In concentrating on the depth of detection of the skullcap, creating film sequences relying on a contrast between sharp and blurred to reflect that lack of sensitivity to neuronal electrical activity lower down in the skull I realised I had neglected colour and that one of the interesting things about the workshop at Cadbury College was the students interest in using different coloured pens as well as different rhythms and gestural responses.
Therefore, with the next film sequence I re-introduced the colour from the students work mediated through my interest in scientific illustration/visualisation which itself has an interesting history of developing styles. Whilst the colour came from the students work the exact nature of the different hues was informed by current scientific data visualisation techniques.
To project in colour
A Study in How Mind and Body Coordinate Rhythms
In August 2023, I was accepted into a six-month artist residency program at the Centre for Systems Modelling & Quantitative Biomedicine (SMQB) at the University of Birmingham. SMQB was looking for artists to collaborate with their researchers on interdisciplinary projects, and I was paired with a DJ beatmatching study.
As a photographer, I am interested in how art and science can intersect to create new perspectives and understanding. I am also drawn to the idea of collaboration. I am excited to work with the SMQB researchers to develop creative outputs that respond to their work.
My DJ experience has given me an understanding of beatmatching, which is the process of synchronising two tempos.
I am interested in exploring how the principles of beatmatching can be applied to other fields, such as science and medicine. The researchers at SMQB are using computer modelling to study the complex rhythms of the human brain. It may be that beatmatching can be used to explore these rhythms in new ways.
The potential for the research to move beyond DJ Beatmatching analysis is limitless.
During my residency at SMQB, I plan to develop a series of creative outputs that will explore the intersection of beatmatching, music, and science.
I am particularly interested in using this project to create new ways of visualising and understanding complex data. Art can be a powerful tool for communicating bewildering ideas, it can bridge gaps and help make science more accessible and engaging to the public.
Making Visuals
My primary goal is to find a way to “visualise the beats.”
While there maybe numerous ways of achieving this, I’ve opted for a more organic and analogue approach by experimenting with a laser beam.
The process involves a loudspeaker playing the audio track. I fixed a mirror to the loudspeaker and directed a laser beam onto it, resulting in a reflection.
This reflection is projected onto an adjacent wall, syncing with the rhythm of the beat. The motion is initiated by the harmonics and resonance present in the audio, giving rise to a distinct pattern.
I’m currently engaged in experiments aimed at capturing a photograph of this pattern. I’m adjusting parameters such as power, aperture, ISO, and shutter speed in a quest to find the perfect visual balance.
Figure 1: A speaker with a drum and mirror attached in the middle. A laser is pointing on the mirror, which will vibrate with the frequency of the beat and project the laser patter on the opposite wall. b) The laser pattern produced on the opposite wall.
Mirror Ball
A mirror ball stands as an iconic symbol, and it is a staple in every respectable club, gracefully suspended above the dance floor. Over time, it has evolved into a historical and traditional element within any club environment.
Recognising the significance of this tradition, I felt compelled to incorporate a mirror ball into our planned multi-media social event. Initially considering a conventional round mirror ball, a more intriguing idea struck me – creating a feature mirror ball that harmonises with our research.
Inspired by the essence of our DJ beat matching project, I conceived the notion of enhancing the mirror ball by incorporating elements representing both the music and visual components. Deliberating on recognisable icons, a camera and a loudspeaker came to mind.
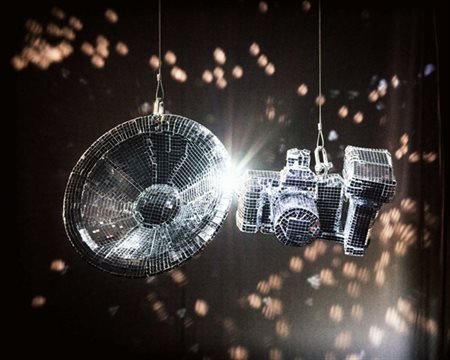
Figure 2: A mirror ball speaker and camera
Crafting a Dignified Representation of the Research Team
As an artist photographer deeply invested in representation, encompassing portraiture, visual sociology, and environmental contexts, my goal is to depict individuals in a dignified and progressive way.
Driven by this personal philosophy and recognising the public’s curiosity about the faces behind the work, I insisted on integrating portraits into our project.
However, the introduction of this concept initially caused nervousness within the team, rooted in the usual anxiety around sitting for a portrait.
We engaged in a discussion to address anxieties, particularly regarding aesthetics.
The team expressed a strong desire to avoid corporate clichés – the ubiquitous smiling faces against bright backgrounds often seen in institutional publicity material. Or the inclusion of environment and clothes which are often used to show rank in the academic world.
I decided to capture data collection tools – the DJ controller, headphones, MacBook Pro, and the EEG cap. I did tests of lighting and composition.
Maria will hold the equipment for the real photographs, showing her hands. The integration of Maria’s hands into the imagery serves to establish a connection between the viewer and the intricate research process. These are the hands that have carried out the research work.
These images will provide another layer of narrative and strengthen the visual meaning.
Figure 3: Portraits of the academic researchers holding a) a DJ deck and b) an EEG cap used to record brain signals during experiments.
Artists in Residence Blog Posts 2022-2023
I have joined a research team at SMQB who are developing a mobile app that will aid in the treatment of leprosy. The app which is currently in development, will contain self-care instructions for the treatment of leprosy and will be used by carers in Nepal. The app concentrates on the use of a set of distinct items the patient needs in order to care for leprosy ulcer themselves and concentrates on the treatment of lesions on the foot.
After meeting with the team initially self-care became the stand out element of the development of the app and that the app will provide a distinct list of items for the patient, they will need for them to care for their leprosy themselves. After reading testimonials from patients, provided by the team, the importance of self care and cleanliness became even more prominent with patients stating that ‘Self care is part of my daily routine and I need to take care of my eyes, hands and feet’. To me the items listed in the app that patients needed for self-care, had huge importance as became a tool kit for the patient in order to aid them in their recovery. The items included a chair, bandages and soap amongst others. I initially picked up on the importance of the bandages within the work, that they would hide the ulcers, highlighting the stigma of the disease, but were also used as a crucial item in the self-care of the ulcers. I began casting the items in bandages as well as my own feet, using the bandages alone to create the effect of the importance of the items as a tool kit for the self-care of the disease. I also began to make drawings and detailed studies of all of items to highlight their significance.
A few weeks after this initial work, I had a meeting with Dr Alex Zhigalov, the member of SMQB from the group to investigate further, the programming of the mobile app and how it will be used to determine the diagnosis of the different self care. Alex explained that the instructions the app gives to the patient is based upon the readings of colours, specifically red, blue and green, in imagery of the patients ulcers. After taking an image of an ulcer the app effectively separates the image in to certain colours and the more red present in the image of the ulcer indicates its severity. The more blue and green within the image indicates the ulcer is healing and a graph like the below is produced in the background and then determines the self care instructed.
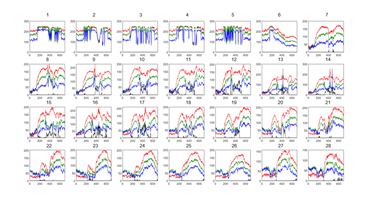
The importance of the colours within the operation of the app became something I then wanted to take forward in my work. The image of an ulcer became the indication for how much care was needed in order for the ulcer to decrease, so the items that were used for self care, that I had earlier concentrated on, were still of significance. As the app effectively pixelated the images to read the colours of the ulcer, I began pixelating images of different ulcers and microscopic forms of leprosy. I found here that the red, blues and greens could become prominent as they do within the programming of the app. To still integrate the element of self-care as well as the importance of items I have begun to construct the pixelated images of the series of ulcers from small bars of soap. I added colours to the soap and cast them as pixels in mainly different hues of reds, greens and blues, as the apps reads.
I then have begun creating a sort of mosaic of the pixelated images. I hope to make 4 soap images of the ulcers of different severity using the coloured soap to illustrate the importance of the self-care and highlighting one of the crucial tools of caring for the ulcers (soap) as well as showing the programming of the app.
As I write this blog, you find me progressed nicely into this sculptural collaboration after a busy weekend of assembling various elements of the scaled up Bacteria Model. I have really enjoyed the process and stages of getting to this part of my Residency. The initial meeting with the Caroline and the Birmingham Uni researchers last year gave me a real insight and inspiration into how the science and an artistic approach could connect. Forming something that is potentially useful in educating but also has its strengths as a piece of sculpture/art. I love collaborating with groups of people who come to the table with very different ideas and hearing what they are passionate about, in this case micro biology. This approach often sparks more interesting ways of creating and allows me to explore new techniques, textures and forms in my own way of designing/sculpting. I really feel this is the case in this project and hope that its reflected in the final model when demonstrated to different groups of people.
After the initial meeting with the researcher at the start of the project, I came back to the group with designs, technical questions that I needed answering and a small concept model. This was a great stage in allowing me understand what the research group needed from the model and all the details to be included in the final demonstration model. This included details like; scale of sculpture, colours, areas of bacteria model to be focused on for explaining how it works and other technical elements. This gave me and hopefully the researchers confidence in the direction for the final model, allowing me to progress to the next stage. I went on to scale up the concept sculpture to form a new final wire frame of the bacteria model approximately 80cm across. I chose a very large size so it can capture peoples attention when demonstrating in a classroom/event, hopefully drawing people in to look inside the inner workings of the Bacteria and learn more about the science behind it. After finishing the skeleton of the model (wire frame/structure), I’ve gone on to add the skin layer (body of the bacterial), this is my own sculpting media made from lots pva and tissue. I have also acquired a wooden stand for the bacteria to be displayed and demonstrated upon. See the featured picture to show my current progress this week. Lots more to do but coming along well, looking forward to adding colours and textural layers next, my favourite part!
Artists in Residence Blog Posts 2021-2022
I am a designer who believes that design plays a big role in how we form mental models of the body. Or in other words, the way we visualise, make, image and communicate the body can significantly change our comprehension or perception of it. This is why this residency is so exciting for me. I have had the honor of working with a team who are designing a fascinating imaging technique to better comprehend the inner workings of a cell. In the case of this particular research project they are focusing on detection of cancer. But the way the image is captured could tell completely different stories about other diseases.
I feel I have learnt a lot from this group of researchers: Robert Neely, Paul Roberts, Anthony Samuel, Dave Smith, Fabian Spill, Sabrina Kombrink. Their research spans vastly differing domains but they have come together to collaborate on this project to make visible the “control panel” of the cell. They are looking at the epigenome, which they describe as a series of switches. They can find out which switches are active by visualising the proteins made in the cell and ultimately decipher which cells are healthy and which are cancerous using this technique. This is potentially an extremely fast diagnostic technique that happens at a cellular level.
They have produced some beautiful snapshots of cells in multiple ways and after a visit to the lab it is clear that cells are far from static. Rob spent a whole day walking me through the process from initial growth of the cell to the final depictions digitalised through their microscope suspended on air on a specialised platform.
I took a scan of the lab, mainly to recall where specific actions take place and to remember our conversations, as much of the work is happening on things that are not visible to the naked eye. After this insightful visit and conversations with the team two salient observations stayed with me. The first being the reasons your cell switches are initiated to turn on and off. According to the team, this can be for a number of reasons but their research really brings to light the impact of daily decisions. Although we are often warned of carcinogens it is quite sobering to think that perhaps even a decision like having stronger cups of coffee in the morning could potentially dictate the change of the switches in the cell. Then seeing Paul present the little blobs on the screen, which I later 3D printed, could be the warning signs for the development of a larger lump. This made me think that even though it may take time and hard work for this to be an available diagnostic technique, the research project this team is conducting could also be considered an important immediate awareness campaign.
Lab scan video
Secondly, at the end of the day of my visit Rob spent some time reflecting on the larger picture and the trajectory of the research. Cancer research is of course an extremely worthy cause, but it was fascinating to hear why this particular project challenge was worthy of Rob’s creative and scientific efforts. It became clear that the cells are valuable in many different ways but they have particularly high research value as they contain significant information that can gift us better understanding of a disease that impacts so many.
With this in mind I have been exploring lots of techniques to create an interactive work that will encompass both of these thoughts. Initially testing some online AR experiences. Now we have moved to the idea of creating an interactive work where audience members generate their own speculative cells in the gallery based on their actions/movement. This has involved learning new software to react to the audience’s motion. The speculative cells will emulate the methylation seen in the cells the team have been imaging (the little blobs that appear to indicate the beginnings of cancerous growth). Then I am trying to explore ways in which we can indicate how dangerous that cell is vs how helpful it might be for research and understanding the disease.
Motion tracking video
The overall idea is to show that our cells have value, it seems that when they are inside the body they are considered functional individual assets, but once they leave the body they are for utilitarian gain (for example for important research to help the many). Cancer cells in particular have a significant and high stake value as they are highly damaging to the body as a whole but also can reproduce rapidly, making them prime real estate for research. Tracking the value of our cells once they no longer become part of the body might raise questions about ownership, once cells leave the body should they be material for utilitarian or individualistic gain? And might changing our view of the value of cells encourage people to take part in research?
For the SMQB residency at the University of Birmingham, I have been working with
Niki Karavitaki,
Gabriela da Silva Xavier,
Amy Coulden, and SMQB Fellow
Alexander Zhigalov on research into precision medicine in acromegaly using metabolome analysis in blood samples. Acromegaly is a rare condition that is caused by a tumor on the pituitary gland in the brain. Otherwise known as gigantism, the condition causes excessive growth and a range of additional medical conditions in children and adults.
Whilst in residence, I have been engaging with the team through monthly meetings to try and understand the processes and aims of their work as well as draw comparisons with my own ways of working and research-led artistic practice. Alongside this, I have also been conversing with patients to gather their perspectives. These interactions have been largely experimental and I have used the time to explore new data-driven technologies such as the program TouchDesigner, build collaborative metaphors and consider the relationship between visual art practices and the representation of the condition historically and in the present day.
I started the residency by talking directly with two female patients who are currently in remission to better understand the lived experiences of the condition. I was keen to center the patients within the context as a way to bring a more ‘human’ aspect to the work which I often find is lacking in data-driven practices. During our conversations, we spoke a lot about how the condition impacted and continues to impact their day-to-day life both physically and mentally. For women, it seems the condition is particularly challenging. As the condition is hormonal it often significantly impacts fertility in addition to causing noticeable changes to one’s physical appearance - including enlarged facial features, hands and feet, as well as weight gain, skin problems, facial hair growth which both women felt significantly impacted their self-confidence and notions of femininity and general wellbeing. Throughout our conversations, we also discussed metaphors that could be used to describe their experience of the condition to others. These included likening the experience to being on a rollercoaster, the tv show ‘Storage Wars’ and a box of fireworks (which could go off at any moment).
After our initial conversations, I was keen to explore how the condition has been represented in visual culture and art history to think through how I might approach making an artwork. Within my own practice, I explore how storytelling and visual cultures shape and produce our understanding of the world, often in relation to new technologies. As a result, I started to gather a database of images from popular culture, scientific journals, and art history to think through how the condition is depicted and question how these images public perception and by extension impact the lived experiences of people with the acromegaly. Mimicking some of the processes used in the research I created a series of collages in an attempt to find patterns, whilst also endeavoring to produce new narratives by cutting and reconfiguring found material.
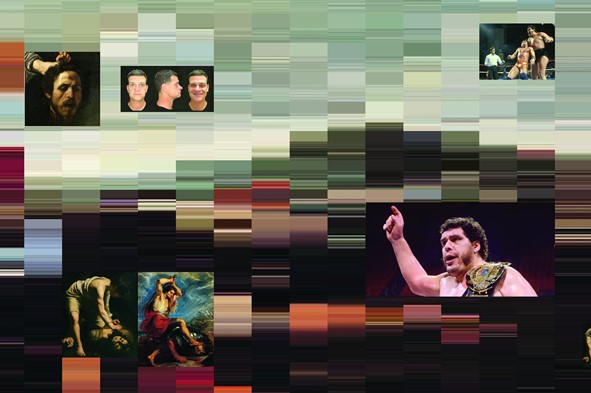
The resulting assemblages featured a range of images associated with the condition from to many different time periods and genres which were connected through visual similarities as defined by human and computer algorithms.
In parallel to this, I also started to work with the data which is being collected, coded and deciphered as part of the research project. Using the data as a material I created a series of digital images or paintings. This was made possible by feeding acromegaly and control data into the computer program Touch Designer. The data comes in the form of an excel sheet with numbers relating to different metabolites which are present in the blood. Using these numbers, I programmed a digital paintbrush that made marks by moving around the screen, in this context the numerical data could be seen as a kind of digital hand creating the image.
Control data painting
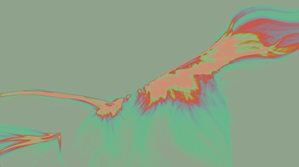
Acromegaly data painting
Moving forward, I was keen to see how these two approaches might work together. Through my monthly conversations with different people on the research team, I have learned how and why this data is being collected in more detail. In this context, it seems the data is being used to map different areas of the body and in doing so reveal a larger picture of how it functions.
Data-driven image reveal stills (paintbrush)
Original photograph: Diane Arbus - A Jewish Giant at Home with his Parents in the Bronx,
New York, 1970
This process was described to me as a kind of road system where more data makes it possible to navigate and discover different areas, routes, and connections. In response to this, I am currently developing some interactive images that use the data to reveal images of people with the condition.
Data-driven image reveal stills (roads/streams)
Original photograph (Bottom, right): Acromegaly: a comparison between a hand enlarged due to a
pituitary gland disease and an adjacent healthy hand. Photograph (by E. H. Cobb ?), 1870/1890.
Public Domain Mark)
Moving forward, I hope to develop these ideas and refine them in line with the different processes which are used by the research team. What I find most intriguing about the project is the collaboration between multiple different disciplines which is necessary to achieve the aim - networks of expertise, material, and data flow together to form a larger picture. In a way, it reminds me of a Rube Goldberg machine, many elements work together as a kind of contraption to achieve a goal. In this case, the goal is to try and identify a biomarker in the blood which would help identify if someone has the condition.
 Rube Goldberg machine - self operating napkin
I am also keen to explore the option of creating some new images of people with the condition to change the negative narratives and often harmful depictions which are associated with it, whilst also making visible a condition that is not widely understood.
Bedtime stories and electrical starbursts (working title)
As an artist I am interested in data. In the past this has led to collaborations with paleopathologists, cardiologists, haematologists and geneticists. I am interested in how information in one context can be processed into words, numbers, graphs and charts, so it can be understood in another. Outsiders and the uninitiated see only random jumbles of letters and digits, lines and squares, but if you understand how to read the ‘Code of the Data’, you can see what could be literally life changing information determining diagnoses or medical treatment.
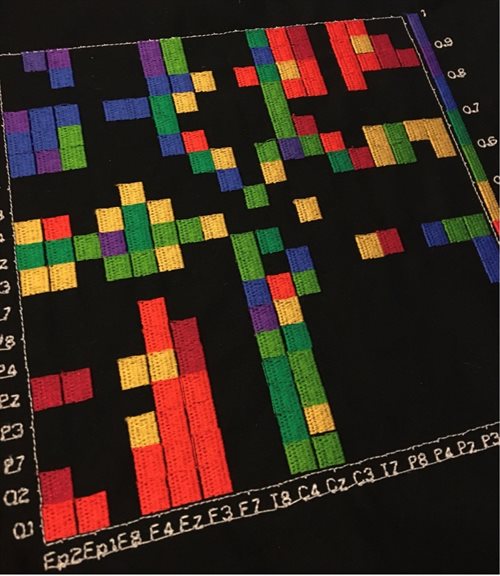 Embroidered neural network matrix showing levels of electrical activity between points in the brain of a child presenting with epilepsy
Epilepsy is a common brain disorder that causes repeated seizures. It can be very difficult to find out if a child has epilepsy, and when they have other conditions at the same time, this can be even harder. Two of the most common conditions that affect children with epilepsy are autism and ADHD. They also affect children's behaviour and brain function. When epilepsy, autism and ADHD are present, it can be very difficult to come to a clear diagnosis and to decide treatment.
The research project I am in residence in is looking to examine electrical brain activity of children with and without these condition to develop computer models that show how these disorders affect the brain.
In our first meeting with the team of Leandro Junges, Andrew Bagshaw, Samuel Johnson and Danny Galvis, some of them described themselves as physicists pretending to be mathematicians. It was clear very early on that there wouldn’t be visits to look at big machines doing things, examining of blood or tissue samples or watching things growing in culture dishes; I wouldn’t need a lab coat. This is a project about harvesting key elements in tests of electrical brain activity (electroencephalogram or EEG) and then developing algorithms to find commonalities that might indicate links within the diagnoses.
Although the outline doesn’t state it, this is a project also about sleep. Testing in sleep can be more likely to show abnormalities and that the change of state from wake to sleep will bring out the relationships between epilepsy, autism and ADHD more clearly. During sleep the brain is in a state that can provide additional and complementary information regarding those disorders But a child or young person presenting with epilepsy is invited in daytime, to a strange place that they might not have been to before (in this case Birmingham Children’s Hospital), to put on a strange and bulky head cap with lots of wires and 21 sensors that touch the scalp and asked to fall asleep. This is something that we all would find difficult to do. In a wider context, the quality of a child’s sleep has a direct effect on their epilepsy. Tired individuals with poor sleep patterns are more likely to have events or seizures.
The data from the EEGs is analysed by specialists and a 20 seconds long epoch to calculate the networks can be produced from each result. This shows the level of electrical activity in the brain picked up by the sensors. The network epoch looks like a decagon with a regular scattering of dots representing the sensors in relation to their placement on the head. The dots are interconnected to each other with a range of thin and thick lines. The denser the line the more correlated is the activity between two points in the brain. Some points remain unconnected. This information can then also be presented on a matrix of blocks of tone or colour illustrating the levels of activity between points. If these patterns are seen reliably, we may have a new way of identifying whether a child has epilepsy, and understanding how their brain activity is affected by symptoms of ADHD and autism’
 Screen grab of epochs and matrices of two subjects illustrating differing levels of electrical brain activity
I began to experiment with the imagery of this data, programming it into the specialist embroidery software mySewnet, that would allow me to embroider it out using digital embroidery machines. I made networks in delicate running stitches, chunky triple stitches and thin lines of satin stitches on black cotton drill to test my digitising before repeating them onto printouts of matrices. Feedback from the team was very positive. I began to create embroidered matrices with a spectrum of rainbow colours. Danny gave me 13 lines from the 500 lines of code he is working on and I stitched it over the star like epochs. I sought out textiles associated with children and sleep and have begun to embroider and overlay networks, matrices and code on children’s pyjamas and blankets.
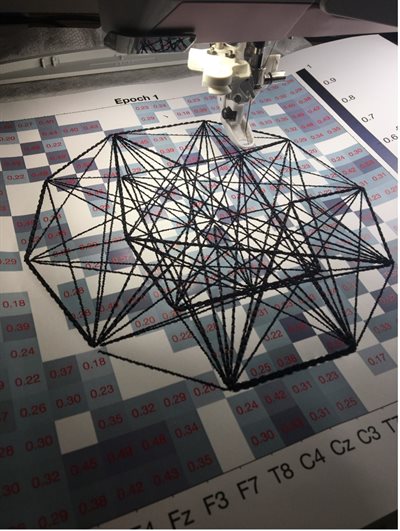 Work in progress. Neural network epoch being embroidered on paper printout of a matrix of the same test
As a research team we have been meeting most fortnights to discuss the progress of the project as a whole. It’s interesting to hear the team talking of excitability and synchronicity, maximum cross correlation, frequencies and mean degrees. They sometimes talk with passion about things I don’t understand; I don’t have the Code of the Data, but that’s alright; they explain the important bits and always answer my questions.
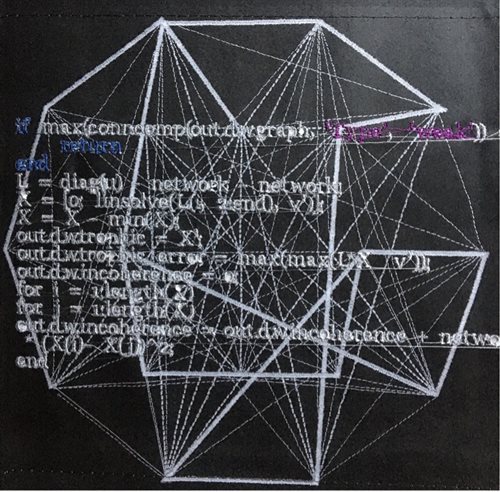 Embroidered lines of code on photocopy of embroidered neural network epoch
When collaborating with scientists or clinicians I try and take a co-creation approach. I talk to specialists, making work on the basis of those conversations and then show the samples back to them to see if I am using the information correctly. I make work informed by the opinions of those ‘educated eyes’ but I am also interested in the lived experience. Now in the Age of Wikipedia everyone can look up information and try and understand. My plan for this residency was always to ask the children and young people and their families their thoughts about the images that I am making and to find out their thoughts about the networks, matrices, stars and block of colour I am creating.
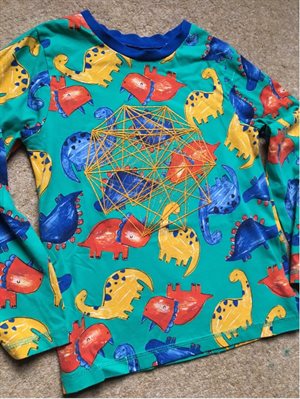 Child’s pyjama top embroidered with a neural network epoch
The Omicron outbreak really messed up our plans to have a family day where I could informally talk to them whilst they did craft activities to see how they felt about their condition and get feedback on my initial samples. We are now hoping that I can safely meet with individual families and do craft activities that will allow those conversations. I would like to ask families to swap a pillowcase that their child has slept on for a new one so I can embroider the data from this project onto the place where they have laid their sleeping head.
As my artist in residence with the SQMB team I am joined with the research team who are investigating the automation and statistical refinement of an unsupervised analysis pipeline for measurable residual disease (MRD) testing in acute myeloid leukemia (AML). This project involves developing new software that can detect remaining leukaemia cancer cells within the bone marrow in patients after treatment. The software will improve the test accuracy and make it easier for tests to be carried out, allowing more people to use MRD testing to improve outcomes for acute Myeloid Leukaemia patients.
As the project began at our 2 day incubator I found it extremely interesting to learn about the background of the project and what the research hoped to achieve. What greatly intrigued me was how the results of the testing was visualised. The graph type formations that are used to diagnose AML in the lab through flow cytometry, were filled with a whole range of colours that represented the cells. These colours were based on fluorescent inks that are added to cells before the tests. The idea that these brightly coloured formations are used to identify if someone has or still has leukaemia, yet the patient never gets to view these is something I hoped to carry through my work.
Through the research I then learned that the team were hoping, through the newly developing software, to look at these graphs in another way, changing the perspective on how they look at the results. Essentially the new software will help them compress the number of graphs into one cluster of colours or cells that will then further improve the way that they identify the leukaemia cells. This cluster really intrigued me especially how beautiful the colours this created and I began making drawings of these based on the images of these the team could provide me with.
Through regular meetings with the researchers I have seen that they are changing the perspective on the way they look at the results of the testing through their research and it is this compression of the visuals and change of view that I hope to develop in the work I produce. I have therefore started to create perspective in the clusters, experimenting with making a fluorescent cell clusters in resin, as well as making individual leukaemia cells within resin that can be hung to reflect perspective. The fluorescent colours I have use match those used in the testing.
On the 16th November I visited the haematology lab with the researchers to learn more about the process of the testing and how the inks are used within the cell samples and how the valuation of the results are created. This was incredibly insightful and I saw first hand how the researchers are looking to improve the look of the results so they can improve the identification of the leukaemia cells.
I will now continue to investigate how I can represent the colours of cells in resin and how these can be displayed to highlight the idea that the researchers are changing their perspective on the way they look at the cells and the visualisations.
I hope to speak to patents in the near future to see their impressions of the visualisations of the results and how they would find seeing the clusters and if they had these to see whether it would alter how they feel about their diagnosis.
SMQB Artists in Residence Blog Posts 2019-2020
SMQB Artists in Residence Blog
Artists in Residence Blog Posts 2024
Charlotte Dunn
https://charlottedunn.co.uk
@charlartslive
Blog 1 - 3rd August 2024
Within my project I am working with a team of researchers who are looking into developing mathematical models of seizure forecasting in epilepsy. This project particularly attracted me as I was diagnosed with epilepsy myself 10 years ago and one of the main concerns that arose through my diagnosis as well as many others living with epilepsy is the unpredictable nature of seizures. Seizure propensity tends to be influenced by “triggers”, for example sleep deprivation, stress and alcohol intake intake. The team I am working with are analysing these such triggers and quantifying these using data from wearable devices. This will then look at giving a patient a seizure forecast for their day, giving them an idea of any seizures they might experience depending on the trigger factors they have been exposed too.
To start the project I began to look at the procedures the team were using to predict the seizures. They were effectively taking a collecting of factors or ‘triggers’ of data and comparing these against a persons usual activity to provide them with a forecast of their seizures. This is something that the patient would check every day and then allow them to plan their day, something we all do when looking at the weather forecast, something that was initial thought when looking at the process.
Weather forecasts are made in a similar way, by collecting data about the current state of the atmosphere and using an understanding of atmospheric processes to predict how the atmosphere will evolve, giving a future forecast. Before any forecast can be made, a meteorologist must first understand what the current weather conditions are and what is producing them, a lot like how the researchers are looking at what triggers are causing the patients seizures. This is done by examining a large quantity of observation data including surface observations, satellite imagery, radar data, radiosonde data, upper-air data, wind profilers, aircraft observations, river gauges, and simply looking outside, comparable to what my team are doing in looking at the collection of seizure triggers, such as stress hormones and sleep activity. This similarity between weather forecasting and the seizure forecasting my team are proposing, has led me to look into creating a series of weather forecasts that would speak about a persons seizure activity rather than the weather. I propose for the forecasts to be filmed as if they they were the same as any weather report we see on the television everyday, but the speaker will be speaking about seizure activity rather than the weather. Behind them as well will be a distorted image that shows in some way activity of the seizures coming and going. This nature of a seizure forecast becoming something we see and watch in our everyday lives, not only shows people that seizure activity is a part of a patients everyday life but also bringing seizure forecasts in to their everyday activity.
I have have begun creating short scripts for the weather reporter to read out, basing these on common weather reports but replacing weather factors with seizure triggers, allowing the overall forecast to become more related to the seizure forecast but still keeping the style of a weather report. For example…
“Welcome to the seizure forecast. Now, let’s see what your epilepsy is like today.
You have been very tired and sleepy so there is a chance of some small seizures, so don’t leave home without a friend! The temperature is around 36o centigrade. So ensure you take your medication. There may be a chance of a seizure in the afternoon as your temperature is a bit higher, at around 39o. Tomorrow and middle of the week your circadian is great. So no seizures for you, but it is quite busy and the temperature is just 35o. The later part of the day has the best forecast today. It’s cloudy most of the time but sunny this afternoon. The temperature is around 35o.”
“Good morning. We will now check the latest epilepsy forecast courtesy of our team in the studio. Let's start with the forecast in the morning. We will experience a fine day today. You will be generally seizure free in the morning but there may be chance of small seizure activity in the afternoon due to small changes in your Circadian Rythm. Luckily there will be zero chance of grand mal seizures due to your consistent temperature and small amounts of alcohol in take. A great sign for sunny things to come! Tour temperature will be 37 degrees. It is advised to take your medication. Now back to the studio."
I also have begun working on the imagery and animations that will appear behind the weather reporter, mapping over meteorology images and moving the colours over in the animations to show the change in the activities but taking away any geographical locations as these are no longer relevant. I have experimented in these with adding images of a brain, or without, and propose to run a focus group help determine what would help patients understand the idea of a forecast more.


Animations with brain drawing overlay.
I am now hoping to book in a studio space to experiment with creating some actual weather reports using a presenter speaking over the images to see how these can be edited together and presented. I am also looking at involving professional weather presenters. I will also further expand upon the scripts and these will be sent to patients to see what words and terminology will be best to use for the forecasts.
Artists in Residence Blog Posts 2023-2024
I am an artist-writer-researcher, contributing to the project “Developing Early Diagnostic Methods for Autism using Magnetoencephalography (MEG): Combining Brain Networks and Deep Learning”.
As a neurodiverse person who also works with neurodiverse people, I was immediately interested in the possibilities that this project could create. There is an exciting potential that waiting list time for ASD could be vastly improved, opening access to supportive systems in a timelier manner, but also, I was quickly wary of the effects that a quantitative diagnosis might have upon contemporary understandings of autism. Because of this, I was keen to provide a qualitative reading of the diagnostic processes presented in this research project through my practice.
The study presents the MEG scan as a preferential form of data collection, particularly when working with children, because it is viewed as a more comfortable experience which is less confining than other sorts of scan. The data was gathered outside of the scope of this project; During the scan, children were asked to watch a screen, and press a button when they see a cartoon dog jump. While completing this activity, their neural network was documented. This led to a confirmation that a neurodivergent child’s brain had far more active connections than a typically developing child.

In response to this data, I thought about the many questions that I would have when presented with this task, based upon sensory, social and logistical concerns that would be present when faced with this scenario as a neurodivergent person. I mapped out some of the questions that arose from this, some of which are shown below:
The Dog:
- I like dogs, will I like this dog?
- What if there’s other animals on the screen and I can’t tell which one is the dog?
- What if the dog is scary?
- Is the dog real or animated?
- What sort of dog?
- Dogs jump differently to humans so am I looking for a dog jump or a human jump?
The Jump:
- What if the jump looks different to what I expected?
- What if the jump makes me jump?
- Will it be a jump scare?
- What if the dog never jumps?
- What if the jump is not obvious?
- How many jumps do I look out for?
The situation and mechanism:
- Will the video be too loud?
- What if I do it wrong?
- Is the room too hot or cold?
- What if the button gets stuck?
- What if I press the button at the wrong time?
- What should I say if I need help?

While the difference between neurodivergent and neurotypical brain network activity was visible on the scan data, the documentation of these questions provides insight into why those additional connections might be happening. This felt particularly important to me to highlight the diversity of experience which can cause such distinctive data.
From here, I began using my mind map to think about how such questions might be taking place inside the brain’s connections, and how the task might be handled differently by a neurotypical brain. I am really interested in using speculative/science fiction within my work, and so this ongoing part of my practice informed how I envisaged these questions in a scripted format, while picking out groups of activity within the scan data. Here, I imagined the connections as lines of conversation between a circle of people. This gave the possibilities of performance as a way of activating the scanned images.
The beginnings of an imagined depiction of how neurotypical brain connections might handle the MEG task
Purple line:
1) Reaction department here. I need to press a button when the dog jumps. Number 2, can you delegate?
2) Task understood. 3, can you locate the button and report back to 1? 4, can you notify the observation team?
3) Button located, see location here 1.
Pink line:
4) Number 5, we need correlating identification on a dog and a jump.
5) Dog located moving from the left of the screen. Number 6, can you alert number 1 when a jump occurs?
6) Step, step, step, step, JUMP! NOTIFY REACTION DEPARTMENT IMMEDIATELY!
The beginnings of an imagined depiction of how neurodiverse brain connections might handle the MEG task
Green line:
1) Will the dog jump at me?
2) Will the dog be scary?
3) Will the jump be a jump scare?
Light blue line:
1) Will it be okay if I change the way I'm lying?
2) If I move my fingers, will it affect the test?
3) Do I need to lie completely still?
4) How long do I have to lie here?
5) I will need to move my fingers to press the button
Dark blue line:
1) What will the button feel like?
2) Will the button be easy to press?
3) Will the button be too stiff?
4) If it is too stiff it could get stuck
5) It could be too loose
6) If it is too loose, I could press the button at the wrong time by accident.
However, my main concern with this activity was that the existence of these two, contrasting scripts is reductive, implying a binary division between the way that autistic and typically developing people will respond to this situation. Other developmental, processing and mental health conditions could all contribute similar results; For example, anxiety could prompt a similar list of questions. This helped me reach a conclusion that perhaps a tabletop roleplaying game (like Dungeons and Dragons) would be better fitting. This would allow the different contributors – working together as the brain network - to be self-directive with guidelines on their individual motives rather than delivering a script. This would allow every version of this situation to occur in a different way, and far better representing the spectrum of experience in ASD rather than expecting a template response.
At this stage, I have moved away from ideas around live performance and am working materially to thinking about how a sci-fi role playing game can be represented in a gallery format. I am interested in how visitors to the exhibition might interact with the roles and priorities of each ‘player’, prompting their own speculation on the MEG activity.
I have a multidisciplinary practice with a foundation in research. Much of my work begins in obscure legend and found objects, being particularly drawn to the stories objects have had before they meet us and the embellishments we add to both the item and the tales around it. Much of my practice looks at that which we memorialise and remember, and I seek to foster an element of joyousness in the work. I develop ideas by making, often creating a body of work as part of this process.
I was really glad to have the opportunity to work with SMQB again due to both the good memories of my part in the inaugural Seedcorn Residency Programme and because it’s a rare opportunity to be part of something that can be life changing. And on this occasion, it has given me the opportunity to be part of the development of something that is a literal science fiction holy grail.
The project is looking at computer modelling methods to speed development of extracellular vesicles (EV’s), nanoparticles that effectively transport the specific building blocks you need to heal. The key is best designing these to transport specific proteins, which is where the modelling comes in.
As a long time Sci-Fi fan it is tremendously exciting to me to be working with something on a nano scale, and something that could make these fantastic medicinal techniques a reality. The basic techniques of handling EV’s is exquisitely alien, from the fluorescent colours used to be able to see them to the use of light refraction to measure them. However, there is also something uncannily homely in their production, with many of the processes resembling food preparation.
My first experiments involved neon food dye, ferrofluid and jelly. Having been told about the movements of EV’s being similar to that of ferrofluid I wanted to see if I could create that same movement on a scale perceptible to humans.
Ferrogloop Video:
Ferrogloop video
My next experiments related to the shapes of the lipids that make up the EVs, consisting of a hydrophilic ‘head’ (which love water) and a pair of hydrophobic ‘tails’ (which avoid water). This put me in mind of rosettes, the glorious celebratory ribbons which we use to celebrate successes, birthdays and much more. I was also drawn to the notion of having the correct EV to transport the correct protein, and the centres of the rosettes seem a perfect means to represent that – and what common building block has a multitude of designs to build different things?
Lego.

So, by filling the centre of the rosettes with Lego I had the potential to build my own model EV with Lego connectors. This then gave me the opportunity to look at other connecting materials, with rosettes using magnets, velcro and fuzzy felt to be able to ‘transport’ materials to where they needed to be.
Finally, I wanted to explore the odd homliness of the process of making EVs, including the use of temperature changes, resting process and so on, on the final result. The process of baking shortbread uses lots of mixing, cooling, resting and so on in order to make biscuits which retain their shape while baking. So my last experiment was making a full model of an EV in iced shortbread, using a rosette shaped cutter and using neon icing to reflect the colours common in nano particle production.

The final presentation of work is likely to be a combination of these – a display of rosettes with different fixings, each ‘carrying’ as much of the representation of the protein (ferrofluid, Lego, wool and felt) as possible, together with biscuit lipids for the audience to take away on the opening night.
When reflecting on the multifaceted aspects of my SMQB artist residency with researchers from the University of Birmingham and Imperial College, I find myself weaving together a complex network of concepts and inspirations. The team provides me with a wealth of information, and I dive into learning about stroke — as a medical condition, physiological mechanism, lived experience, an emotional path to recovery.
From dendrites and neuromuscular junctions to overexcited neurones and stroke neurogenesis, I navigate through scientific concepts and artistic inspirations. Hand exercises for stroke patients, John Bulwer's "Chirologia of the Natural Language of the Hand” and my own Tai Chi practice begin to shape my thinking about the project and its potential artistic expression.
I ponder over the nuances of muscle movements and the challenges posed by spasticity. Spasticity, as a form of stiffness, rather than rigidity, causes resistance to stretching and refuses fluid movement. As I look at my hands, I imagine interrupted circuity. I learn about associative plasticity and the rebuilding of synaptic structures. I am reminded of the Japanese art of Kintsugi, where broken pottery is repaired with gold to highlight the damage and create something new.

 A philosopher, Catherine Malabou, says that there is no bad plasticity. She talks about destructive plasticity. An explosion, which is violent and alogical, yet carries the potential for creating significantly new structures. I speak later with Jumpei and we agree that a change of language could be beneficial. Not repair, not recovery, but development. It's a subtle but powerful shift in perspective that could have a profound impact on our mindset.
I decide to apply destructive behaviours to paper and canvas, I stretch, wring and scrunch. I test larger scale, enjoying incidental monochromatic fields and layers of paint cracking into ambiguous networks.

 A visit to Neuro Rehabilitation research floor at Imperial College offers a glimpse into cutting-edge technologies and, more importantly, life-changing rehabilitation ideas.
I am here to do a mock-up test for a workshop using clay and the vibrotactile rehabilitation device. Patrick pushed hard to get the devices ready for the the first public engagement. I am struck by the juxtaposition of high-tech equipment and the messy nature of clay, and I am reminded of my initial desire that part of my artistic response should be embodied, material and tactile.
Workshop Mockup at Imperial College
We run through a series of clay exercises, tailoring them to engage specific muscle groups while wearing the device. By squeezing and releasing clay in varying intensities, we could work with spasticity and grip strength. Pinching the clay engages flexor muscles, while rolling it between both hands to create elongated coils is great for engaging both flexors and extensors. Slab-building exercise adds broader complexity. I am excited to deliver these exercises to Rosetta Life stroke ambassadors in January.
As a maker, I found it fascinating to sense how the vibration encouraged certain novel movements, creating new gestures that are aware of internal processes, potentially leading to a new way of making. Clay is a fascinating medium to think through as a juncture of techne, cheme, physio. It has an incredible malleability, akin to the human brain's neuroplasticity, that allows it to be moulded, destroyed, and rebuilt.
Clay Workshop with Rosetta Life

The workshop with Rosetta Life stroke ambassadors proves to be a success, with participants enjoying the artistic aspects and providing valuable feedback on the device's effectiveness. I am excited by the possibilities of combining art-making with therapeutic interventions, opening new avenues for exploration.

 Data coming back from the devices is a coded language of beautiful data. Can I use these translations? Possibly. Vibrations underpinned the project from the beginning, currently set at 80 Hz but will be reset closer to 100 Hz. The frequencies for rebuilding muscle strength lie between 2-100 Hz. Cat purring falls between 20-50 Hz anabolic range.
The radial charts make me think of webs, and incidentally, spiders tune their web frequencies to locate their prey. This will be the starting point for sonifying the output from the EMG sensors.
YouTubeEmbedAnja2
Steep learning curve and excitement of getting the initial sound output. I review the ideas with the team, and pull together their suggestions. Like adding additional notes to the trigger to produce a chord. This could make the system sound more musical, although it might also get a bit dissonant depending on the highlighted notes. Or how we could detect continuous muscle contraction e.g. could be used to increase the volume, key tones, or a number of instruments. This could be especially engaging for participants who tend to neglect their affected side.
Thinking further ahead, we could experiment with recording different gestures on one device and replaying them to another participant wearing a second device, which could lead to a "guided therapy" experience. The journey continues…
Alex Billingham (She/Her)
Working internationally across a wide range of mediums I generally pull from my lived experience of being Disabled / Trans / Neurodiverse and Queer. Seeing how my identities collide and intermingle with a variety of different subjects.
I tend to center the work around joy and fun building in space for people to feel uplifted even when dealing with quite difficult subjects. There's a lot of silliness in my style.
I’m currently exhibiting in a 6-month duo show at The New Art Gallery Walsall.
Working with SMQB has been fascinating so far. I’m attached to the team looking at how AI & humans see the world. Led by Jianbo Jiao (Computer Science), Ole Jensen (Psychology) and Cai Wingfield (Advanced Research Computing).
Seeing how my mix of Neurodiversities connects with the project from a non-academic position is fun. Making unusual connections within the work while learning a host of new skills. It’s broadened my approach to making new work.
I’m trying to turn science into art by finding ways of making it relatable and fun while trying to understand it yourself is a challenge but a fun one. I’ve been considering the idea of AI’s being fed on raw internet vs ones fed on selected images being like battery fed vs free range eggs. It’s how we raise AI's which matters.
Learning that AI's are more individual functions i.e. this is yellow etc. What we think of as AI's are actually A N N’s Artificial Neural Networks which pull together thousands of AI’s.
I’m currently building a playable 3D environment in Unreal engine 5 and making a film. Partially shot at Winterbourne Gardens.
I was delighted to be brought into the SMQB artist in residence programme, working on a project in immunotherapy for liver cancer, led by Professor Shishir Shetty. I strongly feel that art has an important role in science; to communicate the thoughts, ideas and phenomena that are tricky to communicate in words. As artist in residence, I feel an enormous responsibility to honour both the scientific endeavour of the researchers and the patient experience.
Faced with the problem of trying to understand why immunotherapy treatments sometimes don’t work on liver cancer, the researchers have been looking at cancerous and healthy liver tissue, specifically looking at what cells are interacting, when and why.
If these cells are colocalised – at the same place and time – they may be interacting. By building up a picture of all the locations of all the cells by imaging fluorescent markers attached to the cell-specific proteins, the team can work together to create a mathematical picture of which cells are interacting.

Abstract forms, looking to communicate the different regions of tissue.
Charcoal, Indian ink and gold ink on paper.
 Triangulation around the peri-tumour region.Fine-line pen and water-based ink on paper.
Once I had understood this scientific question, my thoughts turned to how I would make it into art. I saw it as a giant game of Cluedo – was the immune cell inside the blood vessel with the candlestick? The colocalisation was key to the scientific hypothesis. I thought about the objects and people that an average person shares space with as they go about their day. A person might be colocalised with a box of cornflakes, a double decker bus, a squirrel in the park. Which of these colocalisations would be significant, and which would just be a coincidence? I thought about a patient undergoing treatment for liver cancer – surely they would be colocalised with doctors, medicines and hospitals. Perhaps this could be made into art.
I put this proposition to a group of liver cancer and liver disease patients, in a video call organised by the British Liver Trust. As I explained my idea, I could see that the random objects and places were not important. What was important was the people who shared their journey.
The patients went on to explain something I hadn’t considered – the complex layers of emotion that accompany a cancer diagnosis. A patient might feel sorrow and fear, but I hadn’t guessed that they might also feel guilt for putting their family through the grief of joining them on their cancer journey.
Rightly humbled, I realised that my artistic response needed to have a much more human element. If I wanted to honour the patient experience, I needed to make sure that the human connections, the people who were colocalised alongside patients, were present.
I also realised that it was a futile exercise to recreate the images captured by the scientists: the imaging data are beautiful enough on their own. In communicating the science, I instead chose to explore the scientific process: The initial clinical problem, the experiments to light up the different cells in different colours and see which ones are side by side, the mathematical methods that can be used to quantify what is seen through the microscope. I created initial works that made me think of the cancer, the peri-tumour space –a region in between the tumour and the healthy tissue, and the mathematical methods that rigorously define what it means to be colocalised.
On the human connection side, I thought of the fleeting proximity of people in different environments. If you only had a picture of two people’s hands, in a split-second interaction, would you be able to tell the significance of their relationship? Was their colocalisation indicative of an important connection, or just a coincidence?
Coincidence or human connection? Exploring the parallels between the experimental analysis – are these people significant to one another, or are they just at the same place at the same time?
Sketches in fine-line pen.
A workshop in my studio brought together the research team alongside researchers, patients and interested parties, and presented them with the question ‘what do you wish people knew about liver cancer?’. I supplied them with materials and drawing exercises to facilitate their own artistic communication. In this way, I made sure I had understood the perspectives of the patients and the researchers; to check if there was anything else I hadn’t considered.
Until this workshop, the role of stigma associated with liver cancer and liver disease was another factor I hadn’t been aware of. The associations with alcoholism, whether or not they were accurate, left patients concerned about sharing their journey with their loved ones. This was a darkness to the patient experience that was new to me. It was clear it was important to include this in my art.
At this stage, I am drawing together all these contributing factors. The cancer, the fluorescent biomarkers, the colocalisation, the human connections, the stigma, the layers of complexity, both in the multi-layered images captured by the scientists, and in the complex dynamics of human relationships experienced by the patients. I am attempting to create artworks that communicate all these different layers, of both the science and the experience. It is also important to communicate that what you see depends on the mathematical analysis you do, the way you look the data. In the same way, how you perceive the patient experience depends on how much you are willing to see, and what assumptions you let go of.
Inks and pigments in water.
To explore the human connection, and the ambiguity of colocalisation, I asked friends to send me photos of their hands beside - but not touching - the hand of someone important to them. Drawing in pen, I made the connections between these people deliberately ambiguous. To explore the fluorescence, and the pivotal role of dyes in building up the picture of the cells in and around the liver cancer, I dropped fluorescent dyes and other pigments into water, filming and photographing their dynamics. I now want to experiment with space, creating an artwork that plays on the ambiguity of colocalisation, depending on how it is viewed and interpreted.
Fluorescent inks in water. Art inspired by science.
Inks and pigments in water. Exploring the art of fluid dynamics and entropy.
Can an Epilepsy Chatbot Improve Outcomes for People with Epilepsy? An Artists Residency
I met my research group, based at the Royal Free Hospital in London, at the SMQB Incubator conference in Birmingham last year and I was immediately excited by this project. My personal history with Epilepsy is limited. Although my Dad had a brain tumour and did suffer from seizures, it was never a regular occurrence. My friend’s daughter was diagnosed with Epilepsy some time ago and I’d worked with young people with Epilepsy in a previous role. Despite all that I only knew about their epilepsy and not epilepsy in general. The conversations in our team made it immediately clear how much of a massive impact this condition has on people’s lives. My first thought was – I want to do creative workshops – with patients, family members and research staff. My team was delighted with this idea and we set dates for workshops straight away. I came away from the Incubator event with a clear remit to trial and deliver workshops and use them to create resources for the chatbot.
In October I delivered a Zoom tester workshop to my team. As one of the team members has epilepsy and another works closely with patients, participation was a very moving and humbling experience for me. We had fun, but there were some emotional moments. We knew we would have to make sure we created a safe space in the live workshops. I’d come up with activities that gave participants access to their emotions which could also provide responses that had something to offer in the way of support or teaching, to people using the chatbot. Some activities resonated better than others. I found my shortlist.
Hole in the world
Your death Leaves a hole in the world
How dare you Go – without warning without reason
When you blazed so bright
The day arrived to go to London to the Royal Free Hospital! I got really stressed out with all the travelling and my phone stopped working (updates! Grrr!) so I got lost on the way. I found the room just in time and thankfully there were biscuits and smiling faces, so it was OK. The people in my team are so lovely. Let me pause to introduce them to you:
Heather Angus-Leppan – elegant neurosurgeon, Sarah Jones – visionary and IT systems expert, Isabella Marinelli – inspirational poet-mathematician and SMQB Research Fellow, and the guys – Adam Hutchinson, Tony Wolff and Christopher Appleton, who I don’t know so well, but without whom the chatbot would not happen.
The patients, family members and friends who participated in the group all looked a bit terrified to start with, but conversation, icebreakers and biscuits sorted them out. Through the activities we had fun, got to know each other and explored some difficult feelings. The group had a lot of advice and support to offer each other and the time they spent together was really valuable. One of the things a creative activity does is to promote conversation – even to the point of just giving your hands and eyes something to do makes it easier for things to come out of your mouth. This was a benefit I’d not given enough credence to in designing the workshops. After the workshops finished, the team and I spoke about the value of delivering more live, face to face workshops. If this can go ahead, I’d definitely include more collaborative art activities to help people bond and chat together. Unfortunately this isn’t possible to do through the chatbot – but we were pleased that participants overwhelmingly wanted access to art and creative writing around the subject of epilepsy, and were open to trying activities that were internet based. We also wondered about offering digital video footage to deliver activities – a prospect that’s very exciting. Not because I like being filmed (quite the opposite, believe me!) but because, in my experience, the personal touch works better with this kind of thing.
So, what am I doing now? I’ve turned the creative products of the workshops into a format that can be delivered via the chatbot, and I’ve been busy creating my own response to everything I’ve learnt about epilepsy and what it is like to experience. Alongside the very personal responses of patients and families, I want to offer, as an artist and poet, works that are more coded that people can interpret through their own stories. To this end I’ve been writing poetry and planning a series of paintings that I hope will be thought provoking and empathic.

When the universe is on your side, opportunities arise that can contribute to your work. In this way, I happened to be offered the chance to have some of my writing considered for Coventry Springboard Festival. It’s a genre-bending festival which collides drama with other kinds of writing in collaboration with the company based at the Criterion Theatre in Coventry. The theme is ‘A day that changed Everything’. I immediately thought of the patients I’d met, whose diagnosis of epilepsy had been so profoundly life-changing. So, for the last few weeks I’ve been working with a group of drama-writers and actors to transform my poetry into a short drama for four voices that could be performed at the festival. I really hope this happens, but even if it doesn’t, I’m very excited about the work and you’ll definitely be able to access it in some form as part of the output of my residency.
Also fortuitously, I heard about an offer of some studio space at the Nest, home of Talking Birds Theatre Company in Coventry. So I have a week of studio time booked in which to create some paintings. I’m going for portraits – because epilepsy effects people’s self-image and identity so profoundly. They will be abstract – as I want to use them to portray different kinds of seizure – and I’m going for mixed media, so I can create a texture that represents layers of experience. I can’t wait to get painting!
I hope you’ve enjoyed this blog post and I look forwards, if possible, to meeting you at the exhibition, which will be at the Centrala gallery in Minerva Works, Digbeth, Birmingham from the 7th – 23rd June (with a party on the Friday). Please take time to enjoy the other blogs in this series. There are truly amazing artists with residencies from SMQB this year, and the research projects are absolutely fascinating.
Mapping the Mind: The rhythm of disruption.
I have been working with a research team led by Clare Anderson, involving researchers Andrew Bagshaw and Wessel Woldman, with centre fellow Sophie Mason investigating the disruption of the Circadian Rhythms and its possible relationship and impact upon the neuronal network in the brain.
My artwork response searches for equivalents between the interaction of the elements of drawing (in expanded form: incorporating moving image and three dimensions,) and this neuronal conductivity of electrical activity in the brain that develops these neuronal networks.
It involves drawing’s ability to access deeper mental processes within the brain to be used as an alternative technique to access information in addition to the EEG data.
The disruption of Circadian Rhythms, investigated by the research team as a way of predicting the development of various neurological conditions, could I felt be seen in a more positive light as artists look for ways of disrupting normal thought rhythms to access the deeper mental processes necessary for creative work.
So, although I often think my way through problems through the process of drawing, it felt appropriate that a response to the circadian cycle of night/day, sleeping/waking, dark and light should involve techniques fundamentally involved with actual light and therefore “moving image” quickly became an obvious way forward the projected or screen based. Although a group of drawings have also developed in parallel using a range of tones to reflect the use of light and dark with the light reflecting up through the white of the paper. Studies on a lightbox were also started but time proved too short for these to show significant developments, although the lightboxes played a significant role during the filming of some sequences.
As an equivalent to the EEG data from the sleep deprivation studies, I arranged artistic workshops where alternative “artistic” data could be gathered from participants who were encouraged to search out a series of gestural and rhythmical marks that felt comfortable or significant to them. Early on for speed of experimentation these workshops started using friends and the scientists involved, Cadbury college came on board as a thank you for some studio visits and ultimately sessions were arranged with participants with lived experience through the University.

Just as EEG data is subjected to mathematical modelling through various filters and approaches attempting to analyse the data for significant rhythmical disruptions and its impact on the neuronal networks, so the artistic data was edited using various ways acting as an equivalent to the scientific analysis, producing its own data in the form of a “moving image” sequences. For example, artistic footage when overlayed was “misaligned” to reflect the “out of phase” data from the sleep study where some circadian cycles were displaced from the norm.
I was also struck by the two-dimensional and static nature of the scientific data, either printouts or information scrolling across a screen. Whereas the neuronal networks firing in the brain take place throughout the three-dimensional space of the skull and are constantly firing, admittedly at different rates, particularly at night but are never still! A constant electrical choreography is taking place in a three-dimensional space, and I felt the editing of the artistic sequence should reflect this so initial mark-making footage was further projected around three-dimensional structures and re-filmed. An energic quality was sought in the editing to reflect the constant interaction of the neurons and although this varied to reflect the changes in the circadian cycle, I felt it should be noticeably animated in nature.

The drawings from the workshops were filmed in a variety of ways to reflect the bringing together of the different responses into a usable artistic dataset. For example, the drawn rhythms from the Cadbury College workshop were laid on a lightbox and layers were raised and lowered and moved in relation to one another to reflect the different frequencies of brainwaves that can be detected by the EEG electrodes through the skull and even from this early stage reflected the depth of activity down into the skull. As drawings were raised even the light from the lightbox was unable to stop the lower layers becoming blurred and less clear just as the electrodes in the headcap was unable to detect brain waves lower down.
No EEG
The EEG data and its artistic equivalent were then brought into a collage-like relationship and compared and contrasted. The EEG data now treated on one level as another element in the expanded drawing process and therefore could be shown vertically, inverted, or seen moving in the opposite direction but it provides a “base rhythm” against which the artistic participants mark-making is contrasted.
Projection on again negative
The same process described above was followed in the production of actual drawings in pencil, pen and ink and graphite developing in parallel with moving image pieces. With some drawings taken into three dimensions via a structure based on graphs analysed by the research team and another drawing piece developed in three sections referencing the three brainwaves detectable by the electrodes, the delta, theta, and alpha frequencies, incorporating research into the origins of the word frequency in the Latin “frequential” meaning assembling in great numbers, a crowding, a multitude, or throng.
In concentrating on the depth of detection of the skullcap, creating film sequences relying on a contrast between sharp and blurred to reflect that lack of sensitivity to neuronal electrical activity lower down in the skull I realised I had neglected colour and that one of the interesting things about the workshop at Cadbury College was the students interest in using different coloured pens as well as different rhythms and gestural responses.
Therefore, with the next film sequence I re-introduced the colour from the students work mediated through my interest in scientific illustration/visualisation which itself has an interesting history of developing styles. Whilst the colour came from the students work the exact nature of the different hues was informed by current scientific data visualisation techniques.
To project in colour
A Study in How Mind and Body Coordinate Rhythms
In August 2023, I was accepted into a six-month artist residency program at the Centre for Systems Modelling & Quantitative Biomedicine (SMQB) at the University of Birmingham. SMQB was looking for artists to collaborate with their researchers on interdisciplinary projects, and I was paired with a DJ beatmatching study.
As a photographer, I am interested in how art and science can intersect to create new perspectives and understanding. I am also drawn to the idea of collaboration. I am excited to work with the SMQB researchers to develop creative outputs that respond to their work.
My DJ experience has given me an understanding of beatmatching, which is the process of synchronising two tempos.
I am interested in exploring how the principles of beatmatching can be applied to other fields, such as science and medicine. The researchers at SMQB are using computer modelling to study the complex rhythms of the human brain. It may be that beatmatching can be used to explore these rhythms in new ways.
The potential for the research to move beyond DJ Beatmatching analysis is limitless.
During my residency at SMQB, I plan to develop a series of creative outputs that will explore the intersection of beatmatching, music, and science.
I am particularly interested in using this project to create new ways of visualising and understanding complex data. Art can be a powerful tool for communicating bewildering ideas, it can bridge gaps and help make science more accessible and engaging to the public.
Making Visuals
My primary goal is to find a way to “visualise the beats.”
While there maybe numerous ways of achieving this, I’ve opted for a more organic and analogue approach by experimenting with a laser beam.
The process involves a loudspeaker playing the audio track. I fixed a mirror to the loudspeaker and directed a laser beam onto it, resulting in a reflection.
This reflection is projected onto an adjacent wall, syncing with the rhythm of the beat. The motion is initiated by the harmonics and resonance present in the audio, giving rise to a distinct pattern.
I’m currently engaged in experiments aimed at capturing a photograph of this pattern. I’m adjusting parameters such as power, aperture, ISO, and shutter speed in a quest to find the perfect visual balance.
Figure 1: A speaker with a drum and mirror attached in the middle. A laser is pointing on the mirror, which will vibrate with the frequency of the beat and project the laser patter on the opposite wall. b) The laser pattern produced on the opposite wall.
Mirror Ball
A mirror ball stands as an iconic symbol, and it is a staple in every respectable club, gracefully suspended above the dance floor. Over time, it has evolved into a historical and traditional element within any club environment.
Recognising the significance of this tradition, I felt compelled to incorporate a mirror ball into our planned multi-media social event. Initially considering a conventional round mirror ball, a more intriguing idea struck me – creating a feature mirror ball that harmonises with our research.
Inspired by the essence of our DJ beat matching project, I conceived the notion of enhancing the mirror ball by incorporating elements representing both the music and visual components. Deliberating on recognisable icons, a camera and a loudspeaker came to mind.

Figure 2: A mirror ball speaker and camera
Crafting a Dignified Representation of the Research Team
As an artist photographer deeply invested in representation, encompassing portraiture, visual sociology, and environmental contexts, my goal is to depict individuals in a dignified and progressive way.
Driven by this personal philosophy and recognising the public’s curiosity about the faces behind the work, I insisted on integrating portraits into our project.
However, the introduction of this concept initially caused nervousness within the team, rooted in the usual anxiety around sitting for a portrait.
We engaged in a discussion to address anxieties, particularly regarding aesthetics.
The team expressed a strong desire to avoid corporate clichés – the ubiquitous smiling faces against bright backgrounds often seen in institutional publicity material. Or the inclusion of environment and clothes which are often used to show rank in the academic world.
I decided to capture data collection tools – the DJ controller, headphones, MacBook Pro, and the EEG cap. I did tests of lighting and composition.
Maria will hold the equipment for the real photographs, showing her hands. The integration of Maria’s hands into the imagery serves to establish a connection between the viewer and the intricate research process. These are the hands that have carried out the research work.
These images will provide another layer of narrative and strengthen the visual meaning.
Figure 3: Portraits of the academic researchers holding a) a DJ deck and b) an EEG cap used to record brain signals during experiments.
Artists in Residence Blog Posts 2022-2023
I have joined a research team at SMQB who are developing a mobile app that will aid in the treatment of leprosy. The app which is currently in development, will contain self-care instructions for the treatment of leprosy and will be used by carers in Nepal. The app concentrates on the use of a set of distinct items the patient needs in order to care for leprosy ulcer themselves and concentrates on the treatment of lesions on the foot.
After meeting with the team initially self-care became the stand out element of the development of the app and that the app will provide a distinct list of items for the patient, they will need for them to care for their leprosy themselves. After reading testimonials from patients, provided by the team, the importance of self care and cleanliness became even more prominent with patients stating that ‘Self care is part of my daily routine and I need to take care of my eyes, hands and feet’. To me the items listed in the app that patients needed for self-care, had huge importance as became a tool kit for the patient in order to aid them in their recovery. The items included a chair, bandages and soap amongst others. I initially picked up on the importance of the bandages within the work, that they would hide the ulcers, highlighting the stigma of the disease, but were also used as a crucial item in the self-care of the ulcers. I began casting the items in bandages as well as my own feet, using the bandages alone to create the effect of the importance of the items as a tool kit for the self-care of the disease. I also began to make drawings and detailed studies of all of items to highlight their significance.
A few weeks after this initial work, I had a meeting with Dr Alex Zhigalov, the member of SMQB from the group to investigate further, the programming of the mobile app and how it will be used to determine the diagnosis of the different self-care. Alex explained that the instructions the app gives to the patient is based upon the readings of colours, specifically red, blue and green, in imagery of the patients ulcers. After taking an image of an ulcer the app effectively separates the image in to certain colours and the more red present in the image of the ulcer indicates its severity. The more blue and green within the image indicates the ulcer is healing and a graph like the below is produced in the background and then determines the self care instructed.

The importance of the colours within the operation of the app became something I then wanted to take forward in my work. The image of an ulcer became the indication for how much care was needed in order for the ulcer to decrease, so the items that were used for self care, that I had earlier concentrated on, were still of significance. As the app effectively pixelated the images to read the colours of the ulcer, I began pixelating images of different ulcers and microscopic forms of leprosy. I found here that the red, blues and greens could become prominent as they do within the programming of the app. To still integrate the element of self-care as well as the importance of items I have begun to construct the pixelated images of the series of ulcers from small bars of soap. I added colours to the soap and cast them as pixels in mainly different hues of reds, greens and blues, as the apps reads.
I then have begun creating a sort of mosaic of the pixelated images. I hope to make 4 soap images of the ulcers of different severity using the coloured soap to illustrate the importance of the self-care and highlighting one of the crucial tools of caring for the ulcers (soap) as well as showing the programming of the app.
As I write this blog, you find me progressed nicely into this sculptural collaboration after a busy weekend of assembling various elements of the scaled up Bacteria Model. I have really enjoyed the process and stages of getting to this part of my Residency. The initial meeting with the Caroline and the Birmingham Uni researchers last year gave me a real insight and inspiration into how the science and an artistic approach could connect. Forming something that is potentially useful in educating but also has its strengths as a piece of sculpture/art. I love collaborating with groups of people who come to the table with very different ideas and hearing what they are passionate about, in this case micro biology. This approach often sparks more interesting ways of creating and allows me to explore new techniques, textures and forms in my own way of designing/sculpting. I really feel this is the case in this project and hope that its reflected in the final model when demonstrated to different groups of people.
After the initial meeting with the researcher at the start of the project, I came back to the group with designs, technical questions that I needed answering and a small concept model. This was a great stage in allowing me understand what the research group needed from the model and all the details to be included in the final demonstration model. This included details like; scale of sculpture, colours, areas of bacteria model to be focused on for explaining how it works and other technical elements. This gave me and hopefully the researchers confidence in the direction for the final model, allowing me to progress to the next stage. I went on to scale up the concept sculpture to form a new final wire frame of the bacteria model approximately 80cm across. I chose a very large size so it can capture peoples attention when demonstrating in a classroom/event, hopefully drawing people in to look inside the inner workings of the Bacteria and learn more about the science behind it. After finishing the skeleton of the model (wire frame/structure), I’ve gone on to add the skin layer (body of the bacterial), this is my own sculpting media made from lots pva and tissue. I have also acquired a wooden stand for the bacteria to be displayed and demonstrated upon. See the featured picture to show my current progress this week. Lots more to do but coming along well, looking forward to adding colours and textural layers next, my favourite part!
Artists in Residence Blog Posts 2021-2022
I am a designer who believes that design plays a big role in how we form mental models of the body. Or in other words, the way we visualise, make, image and communicate the body can significantly change our comprehension or perception of it. This is why this residency is so exciting for me. I have had the honor of working with a team who are designing a fascinating imaging technique to better comprehend the inner workings of a cell. In the case of this particular research project they are focusing on detection of cancer. But the way the image is captured could tell completely different stories about other diseases.
I feel I have learnt a lot from this group of researchers: Robert Neely, Paul Roberts, Anthony Samuel, Dave Smith, Fabian Spill, Sabrina Kombrink. Their research spans vastly differing domains but they have come together to collaborate on this project to make visible the “control panel” of the cell. They are looking at the epigenome, which they describe as a series of switches. They can find out which switches are active by visualising the proteins made in the cell and ultimately decipher which cells are healthy and which are cancerous using this technique. This is potentially an extremely fast diagnostic technique that happens at a cellular level.
They have produced some beautiful snapshots of cells in multiple ways and after a visit to the lab it is clear that cells are far from static. Rob spent a whole day walking me through the process from initial growth of the cell to the final depictions digitalised through their microscope suspended on air on a specialised platform.
I took a scan of the lab, mainly to recall where specific actions take place and to remember our conversations, as much of the work is happening on things that are not visible to the naked eye. After this insightful visit and conversations with the team two salient observations stayed with me. The first being the reasons your cell switches are initiated to turn on and off. According to the team, this can be for a number of reasons but their research really brings to light the impact of daily decisions. Although we are often warned of carcinogens it is quite sobering to think that perhaps even a decision like having stronger cups of coffee in the morning could potentially dictate the change of the switches in the cell. Then seeing Paul present the little blobs on the screen, which I later 3D printed, could be the warning signs for the development of a larger lump. This made me think that even though it may take time and hard work for this to be an available diagnostic technique, the research project this team is conducting could also be considered an important immediate awareness campaign.
Lab scan video
Secondly, at the end of the day of my visit Rob spent some time reflecting on the larger picture and the trajectory of the research. Cancer research is of course an extremely worthy cause, but it was fascinating to hear why this particular project challenge was worthy of Rob’s creative and scientific efforts. It became clear that the cells are valuable in many different ways but they have particularly high research value as they contain significant information that can gift us better understanding of a disease that impacts so many.
With this in mind I have been exploring lots of techniques to create an interactive work that will encompass both of these thoughts. Initially testing some online AR experiences. Now we have moved to the idea of creating an interactive work where audience members generate their own speculative cells in the gallery based on their actions/movement. This has involved learning new software to react to the audience’s motion. The speculative cells will emulate the methylation seen in the cells the team have been imaging (the little blobs that appear to indicate the beginnings of cancerous growth). Then I am trying to explore ways in which we can indicate how dangerous that cell is vs how helpful it might be for research and understanding the disease.
Motion tracking video
The overall idea is to show that our cells have value, it seems that when they are inside the body they are considered functional individual assets, but once they leave the body they are for utilitarian gain (for example for important research to help the many). Cancer cells in particular have a significant and high stake value as they are highly damaging to the body as a whole but also can reproduce rapidly, making them prime real estate for research. Tracking the value of our cells once they no longer become part of the body might raise questions about ownership, once cells leave the body should they be material for utilitarian or individualistic gain? And might changing our view of the value of cells encourage people to take part in research?
For the SMQB residency at the University of Birmingham, I have been working with
Niki Karavitaki,
Gabriela da Silva Xavier,
Amy Coulden, and SMQB Fellow
Alexander Zhigalov on research into precision medicine in acromegaly using metabolome analysis in blood samples. Acromegaly is a rare condition that is caused by a tumor on the pituitary gland in the brain. Otherwise known as gigantism, the condition causes excessive growth and a range of additional medical conditions in children and adults.
Whilst in residence, I have been engaging with the team through monthly meetings to try and understand the processes and aims of their work as well as draw comparisons with my own ways of working and research-led artistic practice. Alongside this, I have also been conversing with patients to gather their perspectives. These interactions have been largely experimental and I have used the time to explore new data-driven technologies such as the program TouchDesigner, build collaborative metaphors and consider the relationship between visual art practices and the representation of the condition historically and in the present day.
I started the residency by talking directly with two female patients who are currently in remission to better understand the lived experiences of the condition. I was keen to center the patients within the context as a way to bring a more ‘human’ aspect to the work which I often find is lacking in data-driven practices. During our conversations, we spoke a lot about how the condition impacted and continues to impact their day-to-day life both physically and mentally. For women, it seems the condition is particularly challenging. As the condition is hormonal it often significantly impacts fertility in addition to causing noticeable changes to one’s physical appearance - including enlarged facial features, hands and feet, as well as weight gain, skin problems, facial hair growth which both women felt significantly impacted their self-confidence and notions of femininity and general wellbeing. Throughout our conversations, we also discussed metaphors that could be used to describe their experience of the condition to others. These included likening the experience to being on a rollercoaster, the tv show ‘Storage Wars’ and a box of fireworks (which could go off at any moment).
After our initial conversations, I was keen to explore how the condition has been represented in visual culture and art history to think through how I might approach making an artwork. Within my own practice, I explore how storytelling and visual cultures shape and produce our understanding of the world, often in relation to new technologies. As a result, I started to gather a database of images from popular culture, scientific journals, and art history to think through how the condition is depicted and question how these images public perception and by extension impact the lived experiences of people with the acromegaly. Mimicking some of the processes used in the research I created a series of collages in an attempt to find patterns, whilst also endeavoring to produce new narratives by cutting and reconfiguring found material.

The resulting assemblages featured a range of images associated with the condition from to many different time periods and genres which were connected through visual similarities as defined by human and computer algorithms.
In parallel to this, I also started to work with the data which is being collected, coded and deciphered as part of the research project. Using the data as a material I created a series of digital images or paintings. This was made possible by feeding acromegaly and control data into the computer program Touch Designer. The data comes in the form of an excel sheet with numbers relating to different metabolites which are present in the blood. Using these numbers, I programmed a digital paintbrush that made marks by moving around the screen, in this context the numerical data could be seen as a kind of digital hand creating the image.

Control data painting

Acromegaly data painting
Moving forward, I was keen to see how these two approaches might work together. Through my monthly conversations with different people on the research team, I have learned how and why this data is being collected in more detail. In this context, it seems the data is being used to map different areas of the body and in doing so reveal a larger picture of how it functions.
Data-driven image reveal stills (paintbrush)
Original photograph: Diane Arbus - A Jewish Giant at Home with his Parents in the Bronx,
New York, 1970
This process was described to me as a kind of road system where more data makes it possible to navigate and discover different areas, routes, and connections. In response to this, I am currently developing some interactive images that use the data to reveal images of people with the condition.
Data-driven image reveal stills (roads/streams)
Original photograph (Bottom, right): Acromegaly: a comparison between a hand enlarged due to a
pituitary gland disease and an adjacent healthy hand. Photograph (by E. H. Cobb ?), 1870/1890.
Public Domain Mark)
Moving forward, I hope to develop these ideas and refine them in line with the different processes which are used by the research team. What I find most intriguing about the project is the collaboration between multiple different disciplines which is necessary to achieve the aim - networks of expertise, material, and data flow together to form a larger picture. In a way, it reminds me of a Rube Goldberg machine, many elements work together as a kind of contraption to achieve a goal. In this case, the goal is to try and identify a biomarker in the blood which would help identify if someone has the condition.
 Rube Goldberg machine - self operating napkin
I am also keen to explore the option of creating some new images of people with the condition to change the negative narratives and often harmful depictions which are associated with it, whilst also making visible a condition that is not widely understood.
Bedtime stories and electrical starbursts (working title)
As an artist I am interested in data. In the past this has led to collaborations with paleopathologists, cardiologists, haematologists and geneticists. I am interested in how information in one context can be processed into words, numbers, graphs and charts, so it can be understood in another. Outsiders and the uninitiated see only random jumbles of letters and digits, lines and squares, but if you understand how to read the ‘Code of the Data’, you can see what could be literally life changing information determining diagnoses or medical treatment.
 Embroidered neural network matrix showing levels of electrical activity between points in the brain of a child presenting with epilepsy
Epilepsy is a common brain disorder that causes repeated seizures. It can be very difficult to find out if a child has epilepsy, and when they have other conditions at the same time, this can be even harder. Two of the most common conditions that affect children with epilepsy are autism and ADHD. They also affect children's behaviour and brain function. When epilepsy, autism and ADHD are present, it can be very difficult to come to a clear diagnosis and to decide treatment.
The research project I am in residence in is looking to examine electrical brain activity of children with and without these condition to develop computer models that show how these disorders affect the brain.
In our first meeting with the team of Leandro Junges, Andrew Bagshaw, Samuel Johnson and Danny Galvis, some of them described themselves as physicists pretending to be mathematicians. It was clear very early on that there wouldn’t be visits to look at big machines doing things, examining of blood or tissue samples or watching things growing in culture dishes; I wouldn’t need a lab coat. This is a project about harvesting key elements in tests of electrical brain activity (electroencephalogram or EEG) and then developing algorithms to find commonalities that might indicate links within the diagnoses.
Although the outline doesn’t state it, this is a project also about sleep. Testing in sleep can be more likely to show abnormalities and that the change of state from wake to sleep will bring out the relationships between epilepsy, autism and ADHD more clearly. During sleep the brain is in a state that can provide additional and complementary information regarding those disorders But a child or young person presenting with epilepsy is invited in daytime, to a strange place that they might not have been to before (in this case Birmingham Children’s Hospital), to put on a strange and bulky head cap with lots of wires and 21 sensors that touch the scalp and asked to fall asleep. This is something that we all would find difficult to do. In a wider context, the quality of a child’s sleep has a direct effect on their epilepsy. Tired individuals with poor sleep patterns are more likely to have events or seizures.
The data from the EEGs is analysed by specialists and a 20 seconds long epoch to calculate the networks can be produced from each result. This shows the level of electrical activity in the brain picked up by the sensors. The network epoch looks like a decagon with a regular scattering of dots representing the sensors in relation to their placement on the head. The dots are interconnected to each other with a range of thin and thick lines. The denser the line the more correlated is the activity between two points in the brain. Some points remain unconnected. This information can then also be presented on a matrix of blocks of tone or colour illustrating the levels of activity between points. If these patterns are seen reliably, we may have a new way of identifying whether a child has epilepsy, and understanding how their brain activity is affected by symptoms of ADHD and autism’
 Screen grab of epochs and matrices of two subjects illustrating differing levels of electrical brain activity
I began to experiment with the imagery of this data, programming it into the specialist embroidery software mySewnet, that would allow me to embroider it out using digital embroidery machines. I made networks in delicate running stitches, chunky triple stitches and thin lines of satin stitches on black cotton drill to test my digitising before repeating them onto printouts of matrices. Feedback from the team was very positive. I began to create embroidered matrices with a spectrum of rainbow colours. Danny gave me 13 lines from the 500 lines of code he is working on and I stitched it over the star like epochs. I sought out textiles associated with children and sleep and have begun to embroider and overlay networks, matrices and code on children’s pyjamas and blankets.
 Work in progress. Neural network epoch being embroidered on paper printout of a matrix of the same test
As a research team we have been meeting most fortnights to discuss the progress of the project as a whole. It’s interesting to hear the team talking of excitability and synchronicity, maximum cross correlation, frequencies and mean degrees. They sometimes talk with passion about things I don’t understand; I don’t have the Code of the Data, but that’s alright; they explain the important bits and always answer my questions.
 Embroidered lines of code on photocopy of embroidered neural network epoch
When collaborating with scientists or clinicians I try and take a co-creation approach. I talk to specialists, making work on the basis of those conversations and then show the samples back to them to see if I am using the information correctly. I make work informed by the opinions of those ‘educated eyes’ but I am also interested in the lived experience. Now in the Age of Wikipedia everyone can look up information and try and understand. My plan for this residency was always to ask the children and young people and their families their thoughts about the images that I am making and to find out their thoughts about the networks, matrices, stars and block of colour I am creating.
 Child’s pyjama top embroidered with a neural network epoch
The Omicron outbreak really messed up our plans to have a family day where I could informally talk to them whilst they did craft activities to see how they felt about their condition and get feedback on my initial samples. We are now hoping that I can safely meet with individual families and do craft activities that will allow those conversations. I would like to ask families to swap a pillowcase that their child has slept on for a new one so I can embroider the data from this project onto the place where they have laid their sleeping head.
As my artist in residence with the SQMB team I am joined with the research team who are investigating the automation and statistical refinement of an unsupervised analysis pipeline for measurable residual disease (MRD) testing in acute myeloid leukemia (AML). This project involves developing new software that can detect remaining leukaemia cancer cells within the bone marrow in patients after treatment. The software will improve the test accuracy and make it easier for tests to be carried out, allowing more people to use MRD testing to improve outcomes for acute Myeloid Leukaemia patients.
As the project began at our 2 day incubator I found it extremely interesting to learn about the background of the project and what the research hoped to achieve. What greatly intrigued me was how the results of the testing was visualised. The graph type formations that are used to diagnose AML in the lab through flow cytometry, were filled with a whole range of colours that represented the cells. These colours were based on fluorescent inks that are added to cells before the tests. The idea that these brightly coloured formations are used to identify if someone has or still has leukaemia, yet the patient never gets to view these is something I hoped to carry through my work.
Through the research I then learned that the team were hoping, through the newly developing software, to look at these graphs in another way, changing the perspective on how they look at the results. Essentially the new software will help them compress the number of graphs into one cluster of colours or cells that will then further improve the way that they identify the leukaemia cells. This cluster really intrigued me especially how beautiful the colours this created and I began making drawings of these based on the images of these the team could provide me with.
Through regular meetings with the researchers I have seen that they are changing the perspective on the way they look at the results of the testing through their research and it is this compression of the visuals and change of view that I hope to develop in the work I produce. I have therefore started to create perspective in the clusters, experimenting with making a fluorescent cell clusters in resin, as well as making individual leukaemia cells within resin that can be hung to reflect perspective. The fluorescent colours I have use match those used in the testing.
On the 16th November I visited the haematology lab with the researchers to learn more about the process of the testing and how the inks are used within the cell samples and how the valuation of the results are created. This was incredibly insightful and I saw first hand how the researchers are looking to improve the look of the results so they can improve the identification of the leukaemia cells.
I will now continue to investigate how I can represent the colours of cells in resin and how these can be displayed to highlight the idea that the researchers are changing their perspective on the way they look at the cells and the visualisations.
I hope to speak to patents in the near future to see their impressions of the visualisations of the results and how they would find seeing the clusters and if they had these to see whether it would alter how they feel about their diagnosis.
SMQB Artists in Residence Blog Posts 2019-2020
SMQB Artists in Residence Blog
In February, the SMBQ kicked off our first artist-in-residence programme, bringing together four artists with four new research projects. These research projects are part of the SMQB’s seed-corn scheme, which sees researchers from across different disciplines paired with an SMQB Fellow and supported to collaborate for six months to testbed new research ideas and ways of working. The hope is that at the end of this period, research groups will be better placed to apply for external funding or investment as they will already have some pilot data/proof-of-concept evidence in their back pockets.
One of the most unique aspects of this scheme is our research ‘incubator’ – a two-day retreat (this year held in Bristol) that brings teams together for in-depth planning and development at the very onset of the project. This provides teams with dedicated space and time – both physically and mentally – to focus on their projects, with minimal distractions from other commitments. Importantly, key leads in professional support also take part to help catalyse decisions into action there and then, avoiding the need for teams to waste time organizing individual meetings to do this later on.
Particularly thrilling was that for the very first time we included artists as part of this incubator retreat, embedding them at the very beginning of the collaboration process. The enthusiasm and excitement in having the artists join us was palpable, both from the researchers and professional staff, as well as from members of the public involved in our advisory group who seemed especially interested in how these scientist-artist collaborations would reach new audiences through creative public engagement outputs. The two days were quite full-on and intense for all involved, as plans started to get locked into place, but there was also plenty of time to get to know each other more informally over lunch and dinner, which made the experience an enjoyable one.
Each of our artists is profiled on our webpage where you can find out more about them and see examples of their previous work. We are only part-way through the collaboration now, and in light of everything happening globally due to COVID-19, there are a few hurdles to overcome, but we thought that we’d take this moment to check-in and see how teams are getting on. I’ve also retitled the Artist-in-Residence programme ‘SMQB IncUoBator’ playing on our research incubator and the creative artist connections being made with University of Birmingham (UoB) research. Each of the artists has sent through a little update below. It’s been great to see such a diversity of artistic mediums and interpretations explored, even just at this early stage. We’ll aim to write a few more blog posts every couple of months as part of documenting SMQB’s IncUoBator, so do check back again! Until then, I hope that you are doing well and taking good care of yourself in these unprecedented times.
With very best wishes,
Caroline Gillett, Community & Public Engagement Manager
SMQB IncUoBator: Artist-in Residence Programme Lead
Artist updates
Carol Breen
I am working with the research team investigating beta cell heterogeneity. This project combines state-of-the-art Ca2+ imaging, molecular biology, chemogenetics, gene editing protocols and mathematical modelling. I am re-using cellular information, beta-cell imaging and data visualization – translating this content into new forms. At the research incubator in Bristol, I was interested to learn that oscillations play an important role in cellular processes. The team have created code which converts signals such as islet voltage traces in to sound waves and I look forward to incorporating this in to my work.
The scholar Johanna Drucker notes how a bias often exists toward assuming knowledge represented in mathematical form is an unambiguous representation of thought. Scientific data is often perceived as ‘objective’, I am fascinated by the alternative histories that might be created from this information. The nature of my work is typically abstract, as such I am thinking about the relationship between abstraction and found beauty in science. Working with the, charts, schematics, plots and the scientific models I want to defamiliarize these aesthetics and re-contextualize them for a new audience. During a tour of the labs at The University of Birmingham I had the pleasure of learning more about the live imaging techniques used in this process. I include a picture from my time at the lab and a frame of my work progress…
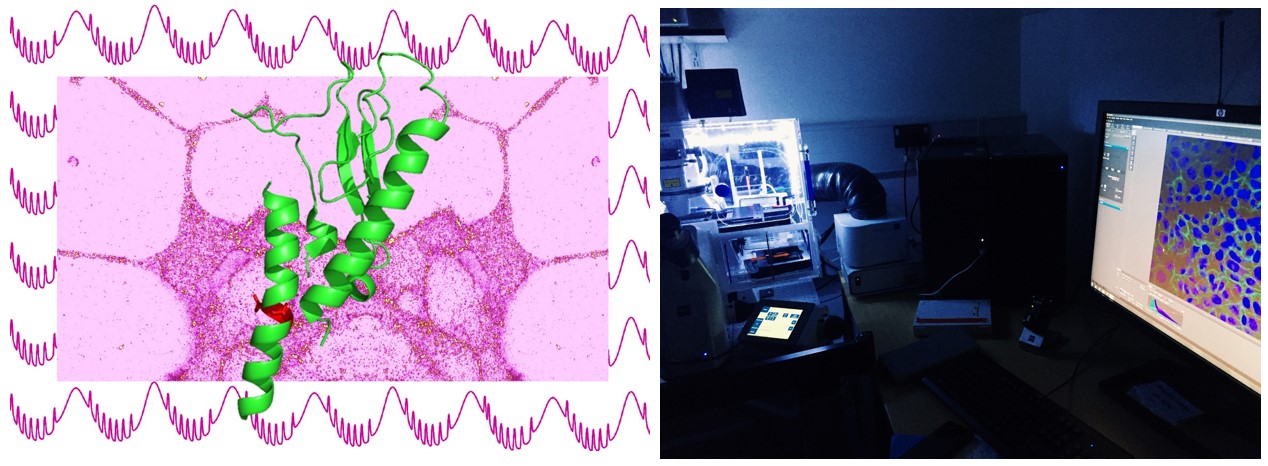 Fig_1. Frame from – science fictions – work in progress | Fig_2. Photograph taken from my lab research trip.
Mellissa Fisher
Papilloedema is caused by intracranial pressure which creates optic disc swelling and can be a symptom of other health problems like brain tumors or brain conditions. The research I am responding to is with the POP study group who are creating an algorithm for an OCT machine to be able to diagnose Papilloedema in your local opticians, rather than being sent to A&E to go through unnecessary and traumatic procedures. My collaborators are Opthamologist Dr Susan Mollen and Mathematicians Leandro Junges and Wessel Woldman who are working with machine learning (AI) to develop algorithms to transform the diagnosis process of Pappilloedema.
The reason I applied for this project is because I was already researching similar areas of science and technology. My research has been focused on a rare brain condition, Idiopathic Intracranial Hypertension (IIH) which cause and cure are unknown. My interest in this condition comes from first hand experience and having a traumatic diagnosis, as well as experiencing symptoms like pulsatile tinnitus, chronic back pain, severe migraines and double vision. I came into this event excited to learn more about my collaborators and work together on ideas of how to visualise the research.
The work I am creating involves data, imaging science, sculpture and technology with an overall goal to make science accessible to a wide audience and to start discussions and raise an awareness and understanding of invisible illnesses like IIH.
Before the project began I started to establish a connection with IIH UK Charity who have helped thousands of people in the UK with information about managing IIH. With the charity I am planning to run focus groups and phone consultations to enable others to share their experiences and use their data to formulate a collective representation of what Pappilloedema looks like.
My current artistic practice is understanding the human body by life casting and sculpting skeletal structures and digital MRI imaging. This stage of the residency is about experimentation and I am currently developing my understanding of algorithms with Leandro which could lead me down a different route and I am working with materials like plaster, silicone, latex, 3D printing. I look forward to sharing what happens next.
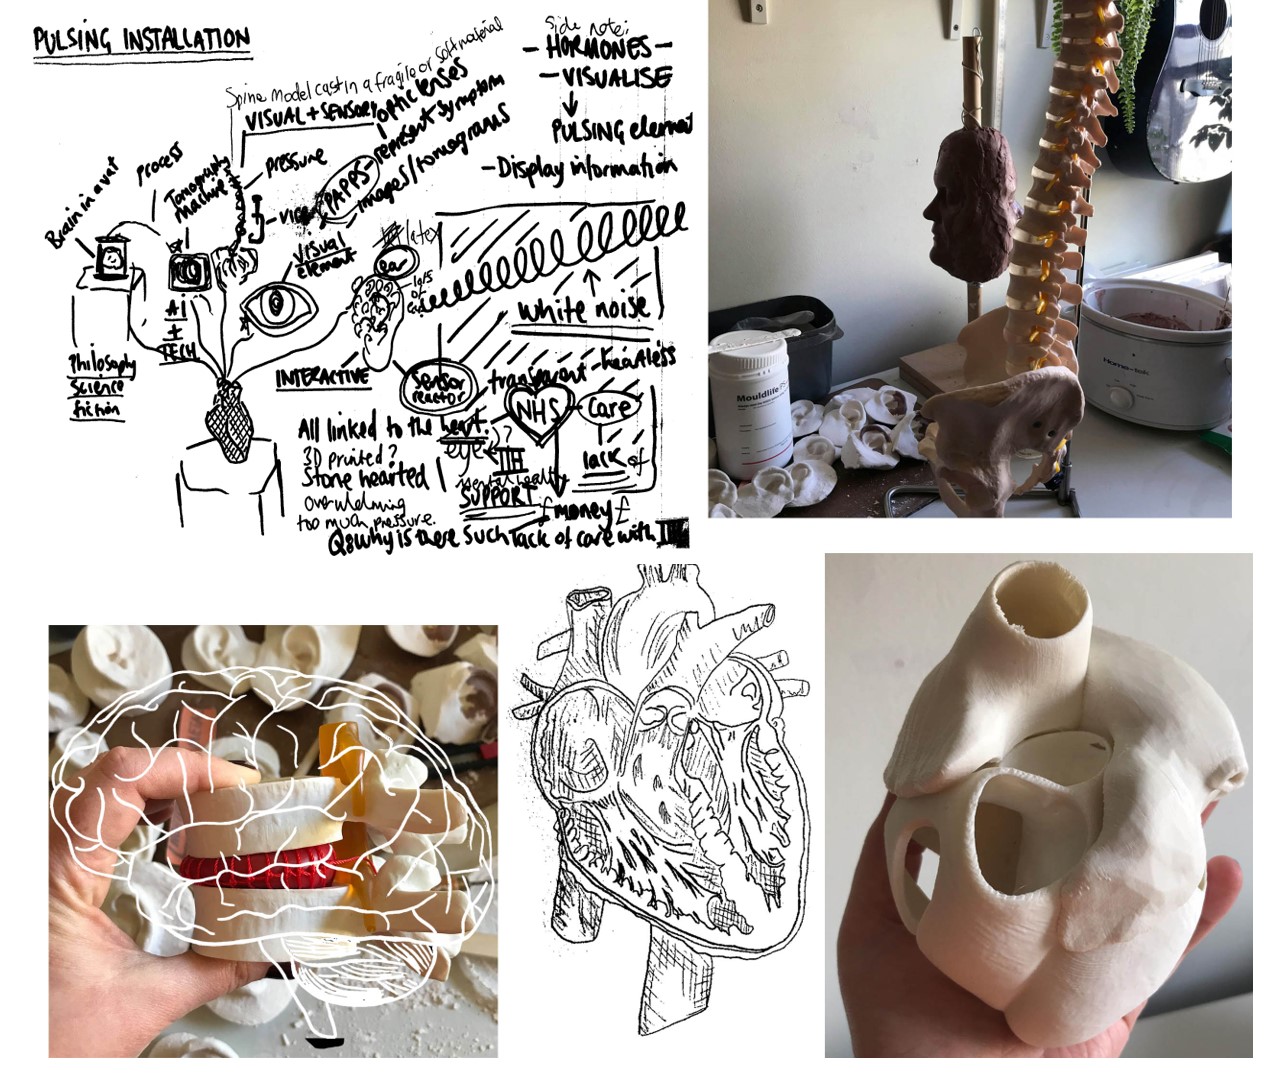
Pietro Bardini
I’m developing a multi-channel sound piece that mimics the interaction model between hormones and inflammatory mediators during cardiac surgery. Together with the researchers I designed an approximated version of this model, which highlights the feedback cycles and the dynamic interactions of each part (Image 1). The resulting composition will be made up of five voices with each voice allocated a distinct output, the sound sources will be arrayed following
the diagram below (Image 2). At the centre of this diagram we find the hormones ACTH and Cortisol, which make up the harmonic centre of the piece. The outer triangle is made up of the inflammatory mediators TNF-α and IL6 and an Inflammation voice. During each composition cycle the outer triangle will move the inflammation harmony from a point of dissonance towards consonance with the harmonic centre. This composition will be generated in real time using Cycling74’ Max.
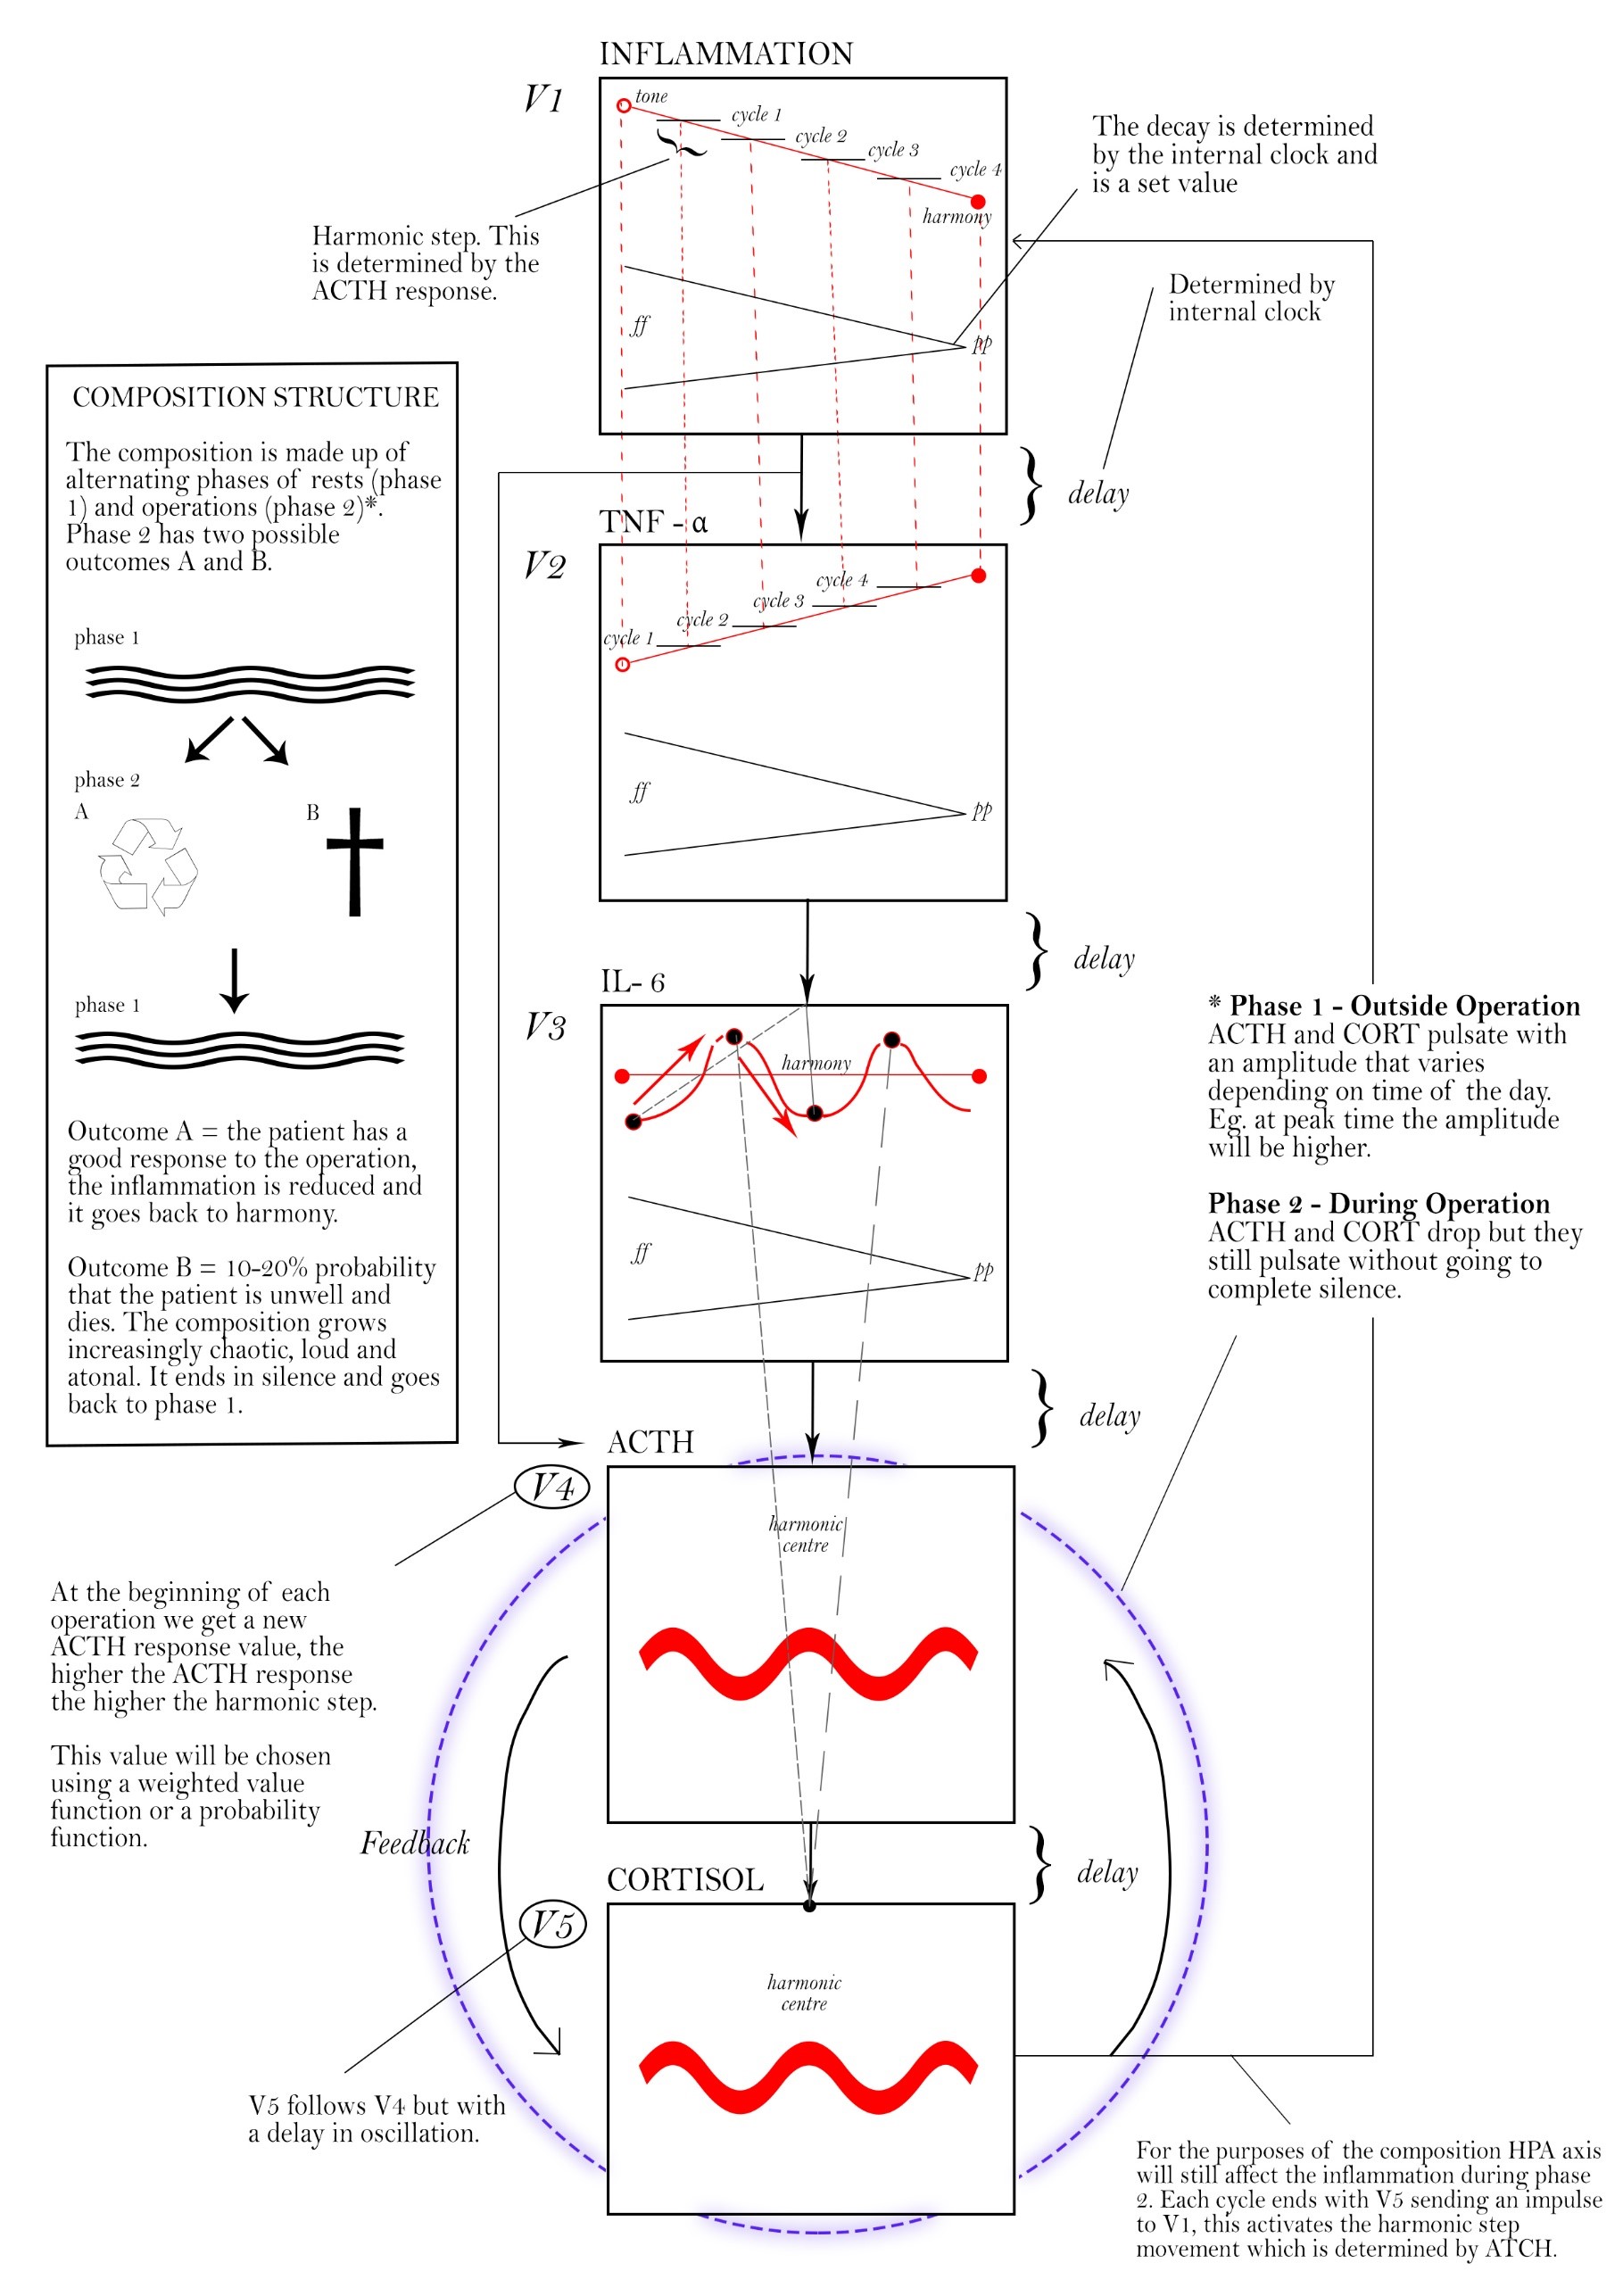
I recently finalised the programming of the model which now self sustains, but it’s only outputting numerical values (Image 3). Currently I’m designing the sounds using Modalys. Modalys is a physical modelling synthesis program by IRCAM, which can be controlled using Max. By using a digital physical modelling synth I am able to easily manipulate in real time complex sounds which are not easy to produce with standard sound synthesis methods such as additive, subtractive or frequency modulation, or by manipulating samples.
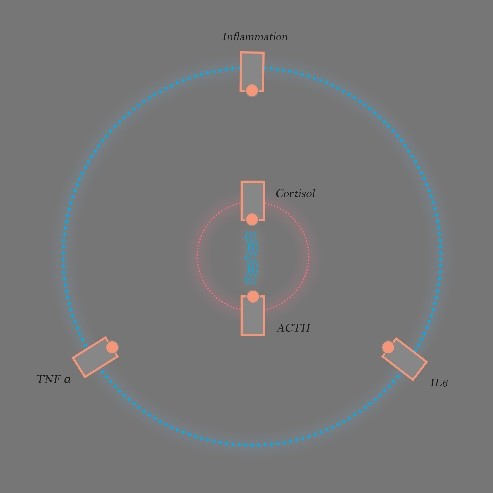
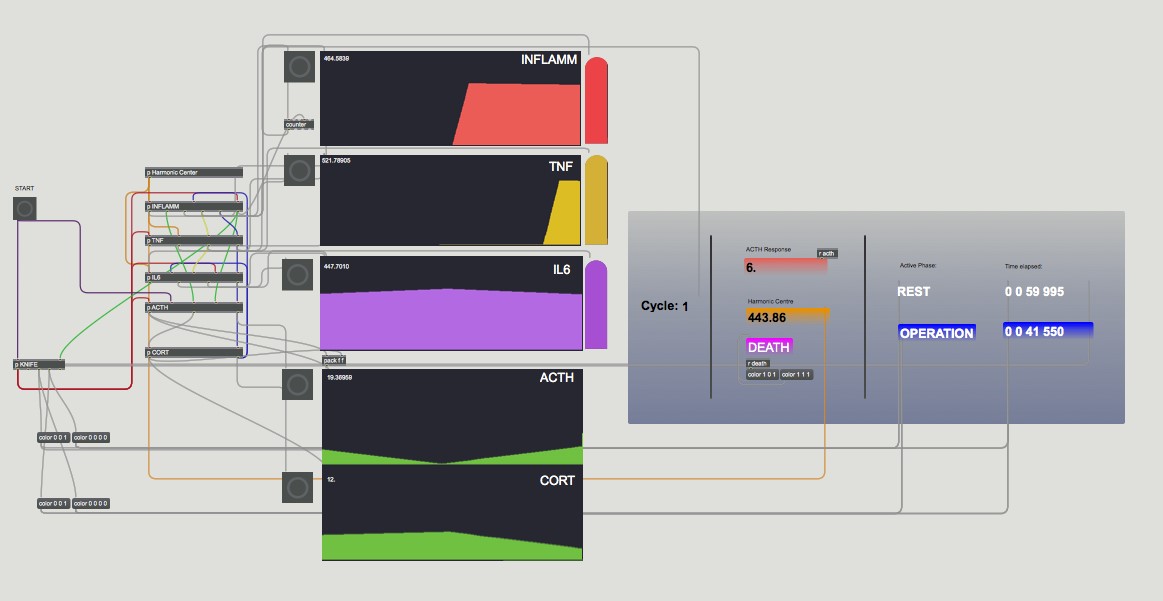
Vicky Roden
As an artist with lived experience of extreme thyrotoxicosis I’m acutely aware of the effect it has on a person’s physical and mental health, and the far reaching repercussions on the rest of one’s life. I have a hundred stories, from embarrassing to hilarious to tragic, which I now understand as being closely related to my condition. Being part of this project has only increased that understanding, and given me a genuine opportunity to contribute to research that could quite literally be life changing. In making this work I’m using both my own experiences and exploring a variety of other aspects of the thyroid, with my initial focus being on it’s shape.
Named for it’s resemblance to an ancient Greek shield, I’ve been exploring this particular shape in relation to my own experiences. Firstly with an embroidery designed to echo the curves of the shield and the nodules of the gland, next with a recreation of the sweet pink tablets I took to manage the condition and thirdly using gold leaf suspended in resin to explore both the classical shield shape alongside the more realistic, visceral appearance. These experiments relate back to my own experiences, such as the visual metaphor of smooth neat stitchwork with a mass of tangled threads behind and the pills recreated from the sugary fondant crème which was a staple of my diet while my metabolism was racing.
My next phase is to establish links with other patients with this condition to share experiences, and to create works around visual indicators of hyperthyroidism (such as goitres and bulging eyes) together with historical references and remedies. I’m also exploring the idea of the treatment of this condition as being a combination of chance and chess including moves, countermoves and fortuity.
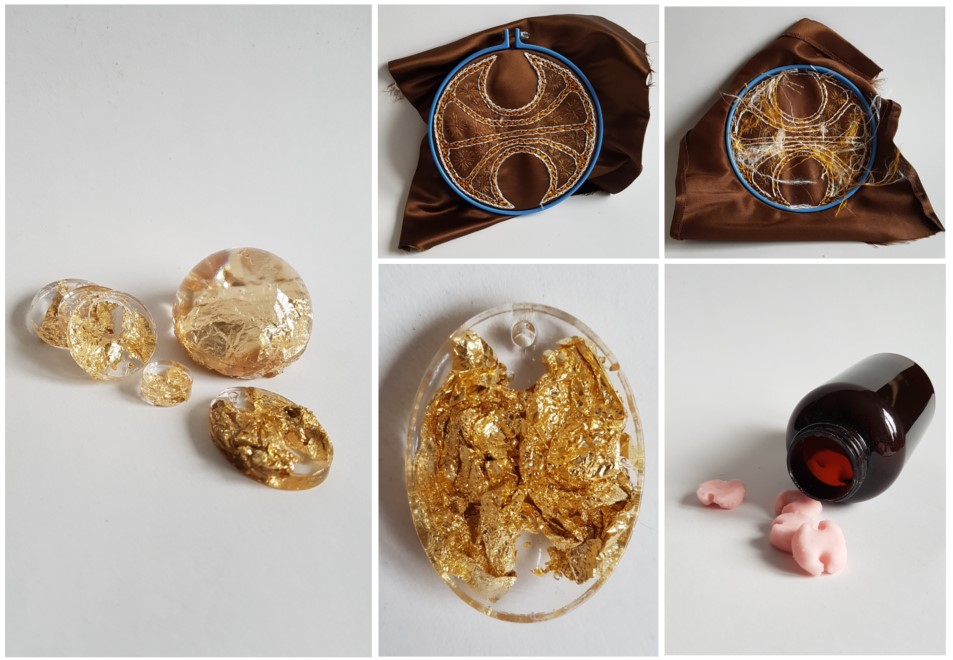
Artist Residency in Lockdown
It seems unbelievable that we are already headed into August. But here we are, already five months into lockdown…
When we first launched our Artist-in-Residence programme, we could have never envisioned the world we’d now be living in and to some extent this new reality must itself be shaping the collaborations and the nature of the artistic work being produced. How could it not? For a start, some of our artists have been without access to their studio spaces, requiring them to skilfully adapt to working in their home environments.
For others, the spotlight on the NHS has prompted a period of self-reflection regarding their own interactions with healthcare services and personal experiences of illness or caring for others. This isn’t unique to our artists or researchers, of course. I think we have all in some way reflected on these themes. The SMQB aims to transform lives through quantitative biomedical and clinical research. Each of our incubator research projects focuses on a healthcare condition(s) and perhaps the sense of wanting to do justice to those professionally dealing with or personally afflicted by a condition is all the more heightened now. In particular, two of our artists have lived experience of the conditions under investigation by the researchers they are collaborating with. This naturally makes these projects more personal.
One of our goals was to host an exhibition of the combined artists’ works in October and this was already pretty much in place before lockdown began. Given the uncertainty surrounding just about everything right now this plan now seems rather too hopeful and I’ve been discussing options with our artist cohort. Even if we could physically host an exhibition this year, would people feel safe and secure enough to come visit it? Undoubtedly many cultural venues and arts organizations are troubleshooting these same scenarios on an even more intensified scale. It must be an incredibly challenging time for this sector – however, given their creative capacity, this community is perhaps at an advantage in dreaming up innovative solutions!
Whatever happens we will be aiming to share our progress and the collaborations with you. At the moment our intention is to exhibit the works together early next year, when safe to do so. However, we are thinking through plans for online activities later this year to bring our artists and researchers together alongside a public audience within a virtual space. To this end it would be really good to know what type of activities people would find valuable. Certainly, we hope to be able to showcase progress of the artworks themselves, but we hope that people will also be interested in hearing about the collaboration process itself – how the research is informing the art and vice versa. I’m currently on a bit of a reconnaissance mission to see what others are doing in this space, so please do get in touch if you see any innovative and effective examples of scientist-artist collaborations in the online world. Take good care of yourself and I hope you enjoy reading our artist updates below.
With very best wishes,
Caroline Gillett, Community & Public Engagement Manager
SMQB IncUoBator: Artist-in Residence Programme Lead
Artist updates
Mellissa Fisher
It has been challenging to get the project moving because of the pandemic and also as collaborator Dr Susan Mollen was deployed to work on COVID until June/July so the research project was put on hold for three months. So in July, I find myself beginning the residency again, in a different way.
So far I am finding being an artist through lockdown a double edged sword. I began with the excitement of having a huge amount of time to get work done, but I did not factor in the stress of the world during a pandemic and how uninformed the government has left us, mixing in with losing the majority of my income as events/exhibitions/jobs were cancelled. Mentioning this, I feel I have used the time as best I can to revisit previous work, make new works surrounding the current climate and developing ideas for this project.
I have taken the time to experiment with a variety of materials and to learn new techniques with materials I haven’t used before which has been incredibly rewarding and to be honest, has kept my mind moving during this surreal time.

Over the last four months I have experienced two IIH (Idiopathic Intracranial Hypertension) migraines, one was worse than the other, but I paid attention to the areas of my body that were affected and started to draw how the symptoms felt. The image below is a type of mind map of the symptoms and how they feel to me. I see the image as a map of a future installation I want to make about IIH.
Throughout my research and development I noticed certain words crop up, such as pressure, prediction and pulsing. Pressure because of increased brain pressure causing Papilloedema, or pressure relating to the NHS. Prediction because of the algorithms collaborator Leandro is working on for the project and pulsing which relates to the symptoms of IIH.
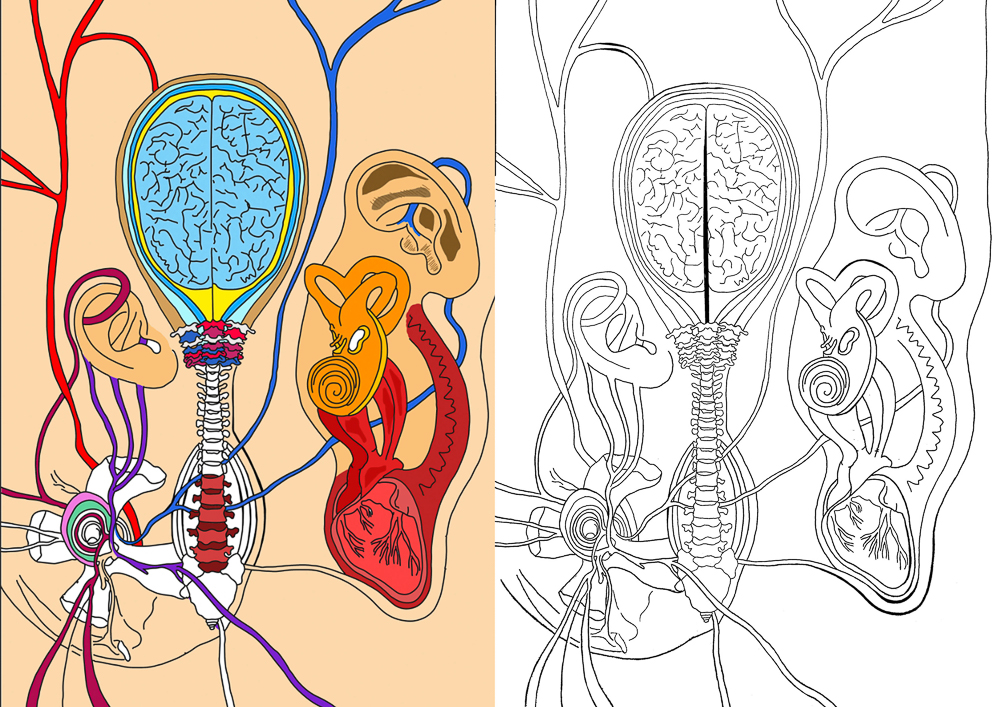
I have also been working through results of a sensory questionnaire I sent out at the beginning of lockdown to the IIH community, to gather descriptions of each person’s symptoms. I am now working towards visualising this data and planning further investigations with virtual focus groups.
Overall, the project is moving at a different pace to what I anticipated, which is good as it allows more time to develop ideas, as always I am looking forward to sharing what happens next.
Melissa’s website | Instagram: @mellissafisherartist | Twitter: @MellEJFisher
Vicky Roden
This project has led to a lot of experimentation and exploration and recently I’ve been focussing on two aspects of hyperthyroidism. Firstly, the challenges of managing an overactive thyroid from a medical perspective, and secondly the actual effects of the condition on the patient’s life.
The way treatment was discussed within the research group felt to me like a mixture of chance and chess – while a doctor can see test results and prescribe medication accordingly there are a myriad of other factors at play and it can take years of testing and adjustment to get the patients levels to a semblance of normality. I’ve begun to develop a board game reflecting the difficulties of managing this – the prototype is completed and available on my website.
Vicky’s website | Cantess | Facebook | Instagram: @vicky.roden | Twitter: @VickyRoden
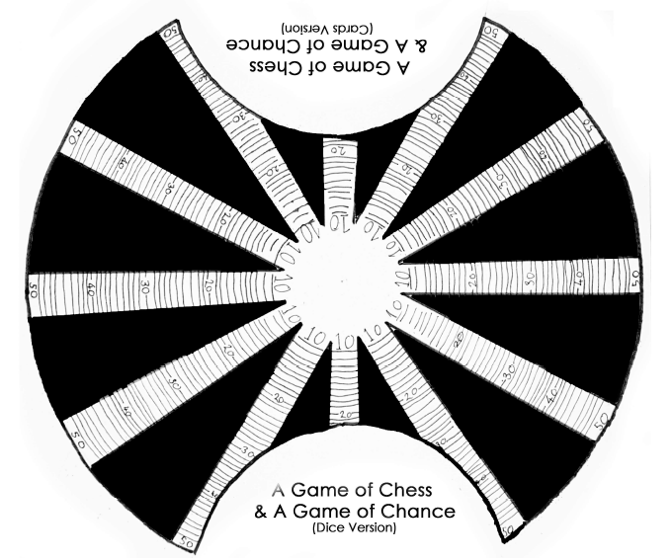 The effect on a patient’s way of life has been a more emotionally difficult area to explore – the condition absolutely took over my life and the recovery felt nothing short of miraculous. I have few tangible memories from that time but found an old photograph that survived the intervening years. My feelings towards the person I was back then, together with the difference in my reaction to the world events at that time compared with my reactions to the very real dangers of the present day made me both realise how far I’ve progressed and be more empathetic to the woman in the photograph. I’ve always described the effect of the radioiodine treatment as being like a static filled TV screen suddenly jumping back into focus, and have used this as the basis for a short film. The first cut is viewable on YouTube below:
First version of a discussion of hyperthyroidism centred around an old photograph
Carol Breen
Bursting Rhythms, Oscillations and Silent Phases:
Oscillations play an important role in the cellular processes that the research team is examining. I have been working with sound waves, derived from islet voltage traces and using these sounds to develop ideas for a visual score as well as re-using and re-purposing elements from schematic representations – and videos of calcium traces related to cell activity, created by the researchers. The language used to describe cell behaviour is beautifully poetic: bursting rhythms, silent phases, rapid voltage, coupling currents, fast and slow bursts, these descriptions have the potential to be re-used as dynamic indications for musical arrangement.
The team and I have talked a lot about how, as researchers, we might learn from each other, and what an audience could gain from our collaboration. We talked about what the general public might associate with the pancreas; many only learn about the diseases associated with this organ, like pancreatitis or diabetes, or for example how the endocrine functions in the pancreas are needed to regulate blood sugar.
My artwork aims to tell a more experimental story about this part of our bodies, as well as illuminating a core feature of the research – that being, how important ‘rhythmic activity’ is in both the artistic and scientific research process. My piece aims to allow the potential for the audience to experience an audio-visual response –to see and hear hidden rhythms active in our own organ. I’ve been researching visual scores created by Iannjs Xenakis, Morton Feldman and Stockhausen. Orchestras are often asked to simply interpret visual scores, musicians sometimes come at these abstract maps without any instructions relating to what these visuals imply for the player, and so the orchestra interprets shapes and patterns through sound. Other times visual music scores come with instructions or keys that gives more information about the visual elements.
In Bristol I remember one of our team saying that organs are essentially orchestras, this stuck with me, because it gives an insight into the complexity and beauty of our bodies, how inner temporalities are happening unbeknown to our everyday temporal experiences. This score will allow for potential conversations to arise surrounding some of the key elements of both the scientific process and the artistic process. I’ll begin teasing out the details of this score over the coming weeks.
In my own research I examine the malleability of data. I am fascinated by digital images, how digital images are all reduced to binary code, yet also function as visual copies in motion. I think about how the resolution of images relates to where and how images are circulated. Hito Steyerl the artist and theorist points out that when digital images are copied they accelerate, and the quality deteriorates. Steyerl reminds us that copies can be ghosts, or previews, thumbnails or errant ideas and that these itinerant images can be distributed for free, squeezed through slow digital connections, compressed, reproduced, ripped, remixed, as well as copied and pasted into other channels of distribution (Steyerl 2009). This time I am working with a totally new economy of digital images – scientific, and this has brought up many different questions about access and circulation. I have thought about how we rarely see inside our own bodies until the orchestra is playing badly. Working with a mix of digital images, copies of high-resolution scientific imagery and schematic representations that derive from modelling predictions, allows me to think about, how complex – digital ontologies of the body are. Technology is blurring distinctions between the human and its others. No longer can we define human existence by unique temporal and spatial coordinates. Digital interfaces disrupt relationships between once separate spaces and increase the complexity of the digital temporal. It is interesting to think about the role rhythm plays on a number of different levels in relation to this research project, to try to understand more about how pattern and rhythm is used in understanding cell activity, while also thinking about rhythm in relation to the algorithmic, the circulation of the digital images, as well as the rhythms of my own methods of re-making in digital space.
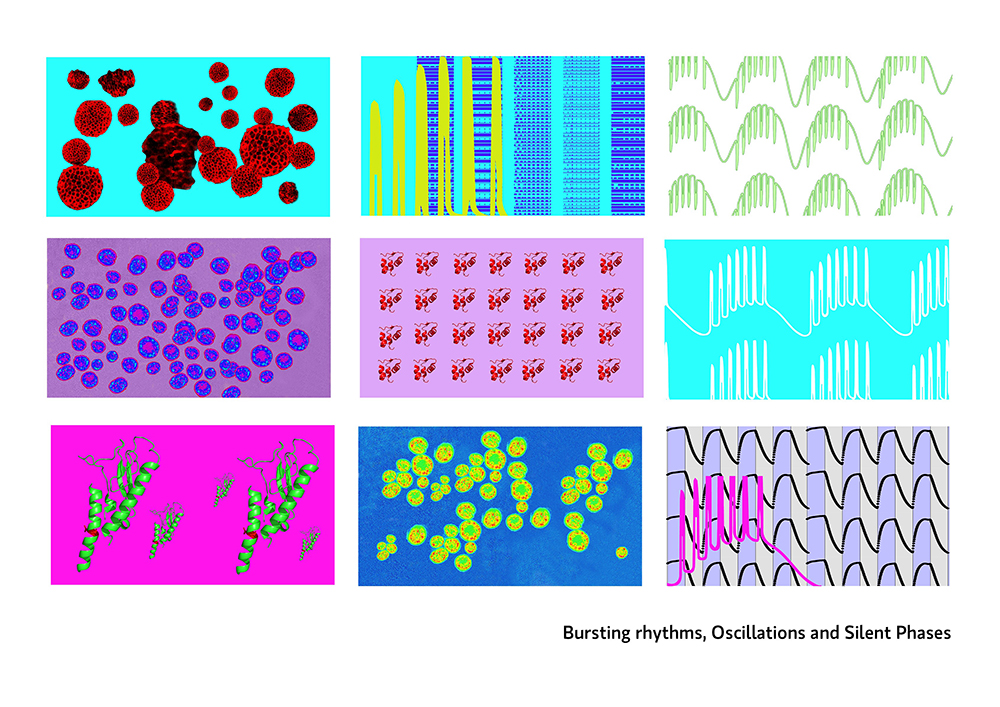
Pietro Bardini:
Since the last update, I’ve been optimising the sound design of the audio channels that will be representing the cytokines TNF-α and IL6, and the overall Inflammation. Since these sounds are generated in real-time through the use of complex algorithms which simulate the sound of metal plates (a synthesis technique called physical modelling ), it can be quite hard on the CPU. To solve this, I removed all user interfaces from the code and some unnecessary frequencies from the sounds.
As well as this I’ve been designing the harmonic centre for the piece.
The harmonic centre functions as the pivot of the composition. As the piece proceeds, the cytokines and the inflammation channels will move from dissonance to consonance with the harmonic centre (pic). The harmonic centre represents the hormones Cortisol and ACTH, its movements mirror the internal feedbacks that occur between Cortisol and ACTH as shown in the study.
I am currently fine-tuning and adjusting the movements of each channel. After this, I will proceed to generate a real-time visual representation of these movements which will give an insight to its inner workings. This will be shown alongside the sound piece.
Artist Residency in Lockdown
It seems unbelievable that we are already headed into August. But here we are, already five months into lockdown…
When we first launched our Artist-in-Residence programme, we could have never envisioned the world we’d now be living in and to some extent this new reality must itself be shaping the collaborations and the nature of the artistic work being produced. How could it not? For a start, some of our artists have been without access to their studio spaces, requiring them to skilfully adapt to working in their home environments.
For others, the spotlight on the NHS has prompted a period of self-reflection regarding their own interactions with healthcare services and personal experiences of illness or caring for others. This isn’t unique to our artists or researchers, of course. I think we have all in some way reflected on these themes. The SMQB aims to transform lives through quantitative biomedical and clinical research. Each of our incubator research projects focuses on a healthcare condition(s) and perhaps the sense of wanting to do justice to those professionally dealing with or personally afflicted by a condition is all the more heightened now. In particular, two of our artists have lived experience of the conditions under investigation by the researchers they are collaborating with. This naturally makes these projects more personal.
One of our goals was to host an exhibition of the combined artists’ works in October and this was already pretty much in place before lockdown began. Given the uncertainty surrounding just about everything right now this plan now seems rather too hopeful and I’ve been discussing options with our artist cohort. Even if we could physically host an exhibition this year, would people feel safe and secure enough to come visit it? Undoubtedly many cultural venues and arts organizations are troubleshooting these same scenarios on an even more intensified scale. It must be an incredibly challenging time for this sector – however, given their creative capacity, this community is perhaps at an advantage in dreaming up innovative solutions!
Whatever happens we will be aiming to share our progress and the collaborations with you. At the moment our intention is to exhibit the works together early next year, when safe to do so. However, we are thinking through plans for online activities later this year to bring our artists and researchers together alongside a public audience within a virtual space. To this end it would be really good to know what type of activities people would find valuable. Certainly, we hope to be able to showcase progress of the artworks themselves, but we hope that people will also be interested in hearing about the collaboration process itself – how the research is informing the art and vice versa. I’m currently on a bit of a reconnaissance mission to see what others are doing in this space, so please do get in touch if you see any innovative and effective examples of scientist-artist collaborations in the online world. Take good care of yourself and I hope you enjoy reading our artist updates below.
With very best wishes,
Caroline Gillett, Community & Public Engagement Manager
SMQB IncUoBator: Artist-in Residence Programme Lead
Artist updates
Mellissa Fisher
It has been challenging to get the project moving because of the pandemic and also as collaborator Dr Susan Mollen was deployed to work on COVID until June/July so the research project was put on hold for three months. So in July, I find myself beginning the residency again, in a different way.
So far I am finding being an artist through lockdown a double edged sword. I began with the excitement of having a huge amount of time to get work done, but I did not factor in the stress of the world during a pandemic and how uninformed the government has left us, mixing in with losing the majority of my income as events/exhibitions/jobs were cancelled. Mentioning this, I feel I have used the time as best I can to revisit previous work, make new works surrounding the current climate and developing ideas for this project.
I have taken the time to experiment with a variety of materials and to learn new techniques with materials I haven’t used before which has been incredibly rewarding and to be honest, has kept my mind moving during this surreal time.

Over the last four months I have experienced two IIH (Idiopathic Intracranial Hypertension) migraines, one was worse than the other, but I paid attention to the areas of my body that were affected and started to draw how the symptoms felt. The image below is a type of mind map of the symptoms and how they feel to me. I see the image as a map of a future installation I want to make about IIH.
Throughout my research and development I noticed certain words crop up, such as pressure, prediction and pulsing. Pressure because of increased brain pressure causing Papilloedema, or pressure relating to the NHS. Prediction because of the algorithms collaborator Leandro is working on for the project and pulsing which relates to the symptoms of IIH.

I have also been working through results of a sensory questionnaire I sent out at the beginning of lockdown to the IIH community, to gather descriptions of each person’s symptoms. I am now working towards visualising this data and planning further investigations with virtual focus groups.
Overall, the project is moving at a different pace to what I anticipated, which is good as it allows more time to develop ideas, as always I am looking forward to sharing what happens next.
Melissa’s website | Instagram: @mellissafisherartist | Twitter: @MellEJFisher
Vicky Roden
This project has led to a lot of experimentation and exploration and recently I’ve been focussing on two aspects of hyperthyroidism. Firstly, the challenges of managing an overactive thyroid from a medical perspective, and secondly the actual effects of the condition on the patient’s life.
The way treatment was discussed within the research group felt to me like a mixture of chance and chess – while a doctor can see test results and prescribe medication accordingly there are a myriad of other factors at play and it can take years of testing and adjustment to get the patients levels to a semblance of normality. I’ve begun to develop a board game reflecting the difficulties of managing this – the prototype is completed and available on my website.
Vicky’s website | Cantess | Facebook | Instagram: @vicky.roden | Twitter: @VickyRoden
 The effect on a patient’s way of life has been a more emotionally difficult area to explore – the condition absolutely took over my life and the recovery felt nothing short of miraculous. I have few tangible memories from that time but found an old photograph that survived the intervening years. My feelings towards the person I was back then, together with the difference in my reaction to the world events at that time compared with my reactions to the very real dangers of the present day made me both realise how far I’ve progressed and be more empathetic to the woman in the photograph. I’ve always described the effect of the radioiodine treatment as being like a static filled TV screen suddenly jumping back into focus, and have used this as the basis for a short film. The first cut is viewable on YouTube below:
First version of a discussion of hyperthyroidism centred around an old photograph
Carol Breen
Bursting Rhythms, Oscillations and Silent Phases:
Oscillations play an important role in the cellular processes that the research team is examining. I have been working with sound waves, derived from islet voltage traces and using these sounds to develop ideas for a visual score as well as re-using and re-purposing elements from schematic representations – and videos of calcium traces related to cell activity, created by the researchers. The language used to describe cell behaviour is beautifully poetic: bursting rhythms, silent phases, rapid voltage, coupling currents, fast and slow bursts, these descriptions have the potential to be re-used as dynamic indications for musical arrangement.
The team and I have talked a lot about how, as researchers, we might learn from each other, and what an audience could gain from our collaboration. We talked about what the general public might associate with the pancreas; many only learn about the diseases associated with this organ, like pancreatitis or diabetes, or for example how the endocrine functions in the pancreas are needed to regulate blood sugar.
My artwork aims to tell a more experimental story about this part of our bodies, as well as illuminating a core feature of the research – that being, how important ‘rhythmic activity’ is in both the artistic and scientific research process. My piece aims to allow the potential for the audience to experience an audio-visual response –to see and hear hidden rhythms active in our own organ. I’ve been researching visual scores created by Iannjs Xenakis, Morton Feldman and Stockhausen. Orchestras are often asked to simply interpret visual scores, musicians sometimes come at these abstract maps without any instructions relating to what these visuals imply for the player, and so the orchestra interprets shapes and patterns through sound. Other times visual music scores come with instructions or keys that gives more information about the visual elements.
In Bristol I remember one of our team saying that organs are essentially orchestras, this stuck with me, because it gives an insight into the complexity and beauty of our bodies, how inner temporalities are happening unbeknown to our everyday temporal experiences. This score will allow for potential conversations to arise surrounding some of the key elements of both the scientific process and the artistic process. I’ll begin teasing out the details of this score over the coming weeks.
In my own research I examine the malleability of data. I am fascinated by digital images, how digital images are all reduced to binary code, yet also function as visual copies in motion. I think about how the resolution of images relates to where and how images are circulated. Hito Steyerl the artist and theorist points out that when digital images are copied they accelerate, and the quality deteriorates. Steyerl reminds us that copies can be ghosts, or previews, thumbnails or errant ideas and that these itinerant images can be distributed for free, squeezed through slow digital connections, compressed, reproduced, ripped, remixed, as well as copied and pasted into other channels of distribution (Steyerl 2009). This time I am working with a totally new economy of digital images – scientific, and this has brought up many different questions about access and circulation. I have thought about how we rarely see inside our own bodies until the orchestra is playing badly. Working with a mix of digital images, copies of high-resolution scientific imagery and schematic representations that derive from modelling predictions, allows me to think about, how complex – digital ontologies of the body are. Technology is blurring distinctions between the human and its others. No longer can we define human existence by unique temporal and spatial coordinates. Digital interfaces disrupt relationships between once separate spaces and increase the complexity of the digital temporal. It is interesting to think about the role rhythm plays on a number of different levels in relation to this research project, to try to understand more about how pattern and rhythm is used in understanding cell activity, while also thinking about rhythm in relation to the algorithmic, the circulation of the digital images, as well as the rhythms of my own methods of re-making in digital space.

Pietro Bardini:
Since the last update, I’ve been optimising the sound design of the audio channels that will be representing the cytokines TNF-α and IL6, and the overall Inflammation. Since these sounds are generated in real-time through the use of complex algorithms which simulate the sound of metal plates (a synthesis technique called physical modelling ), it can be quite hard on the CPU. To solve this, I removed all user interfaces from the code and some unnecessary frequencies from the sounds.
As well as this I’ve been designing the harmonic centre for the piece.
The harmonic centre functions as the pivot of the composition. As the piece proceeds, the cytokines and the inflammation channels will move from dissonance to consonance with the harmonic centre (pic). The harmonic centre represents the hormones Cortisol and ACTH, its movements mirror the internal feedbacks that occur between Cortisol and ACTH as shown in the study.
I am currently fine-tuning and adjusting the movements of each channel. After this, I will proceed to generate a real-time visual representation of these movements which will give an insight to its inner workings. This will be shown alongside the sound piece.