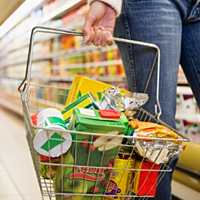
Do melons, sweet potatoes, craft beer and e-cigarettes feature in your weekly shop? They’ve been added to the shopping basket of goods that’s used to measure UK inflation, while sat navs and yoghurt drinks have been taken out. For many commentators the change has been taken as a sign of shifting British tastes, but that aspect of CPI is more tangential than actual.
Every year the Office of National Statistics (ONS) releases details of the latest basket, the contents of which make up the Consumer Prices Index. Known as CPI, there’s a reason it doesn’t stand for Cultural Preferences Illustrator.
The yardstick is that a basket item should account for between £100m and £400m of annual sales. If they drop below the lower limit they will usually drop out of the CPI, and that is the qualifying level for new entrants too.
The CPI shows the history of prices of a basket of consumer goods and services including food, gardening products, alcohol, tobacco, sporting and recreational services. It is calculated by taking price changes for each item with goods weighted by importance and then averaging them. Effectively the CPI is tracking changes in these averaged prices over time and therefore acts as an important measure of inflation.
To ensure representativeness, the CPI involves collecting sample prices of around 700 goods and services in 140 areas in the UK. That means that every month they are collecting 180,000 separate prices. Some goods are unlikely to ever be taken out of the shopping basket of goods as they are so important in terms of the amount of household spending allocated to them. These include petrol, electricity and gas.
So the CPI’s basket of goods gives us a measure of how prices have risen or fallen month on month. If the CPI is 2% that means that on average the price of products and services is 2% higher. Importantly, CPI does not include housing costs including mortgage interest payments and council tax, which the Retail Price Index does.
Therefore one way of looking at it is as a good representation of what you would be spending after you have paid your mortgage or rent, and council tax, which for many is their major monthly outgoing.
A marker of changing tastes?
While the media is busy identifying how our tastes have changed, the ONS points out that the contents of the basket and the changes from one year to the next should not be given overdue emphasis. Their purpose is to help give a representative picture when estimating price changes.
Of course the baskets do reflect changes in consumer tastes, but more importantly they illustrate innovation in consumer products and services. E-cigarettes were not available five years ago and smart phones have shifted the marketplace away from separate navigation devices. Clearly sweet potatoes and melons have been with us for some time and yoghurt drinks have not suddenly gone out of favour with the British public. But their inclusion (or disqualification) is probably more to do with the overall make-up of the basket rather than anything more significant.
The ONS emphasises that the changes in the basket of goods reflects a range of considerations including the practicality of collecting prices and an ongoing objective of improving coverage of high spending areas such as food. Also there is a statistical issue whereby estimating price changes can be improved at the margin by varying the number or type of representative items collected. This means that in any product grouping they use a degree of subjective judgement in terms of the choice of products and the weights they attach to them.
So, while it’s fun to comment on the items added to and removed from the basket, it is important not to see the CPI as some kind of cultural mirror but always as ensuring a representation of the goods and services we buy.
Professor Isabelle Szmigin, Professor of Marketing, Birmingham Business School, University of Birmingham. This article was originally published on The Conversation.